| Section |
Page |
| P4000 SAN Solution user guide |
1 |
| Contents |
3 |
| 1 Getting started |
25 |
| Using the CMC |
25 |
| Auto discover |
25 |
| The CMC |
25 |
| Performing tasks in the CMC using the menu bar |
27 |
| Using the navigation window |
27 |
| Logging in |
27 |
| Traversing the navigation window |
27 |
| Getting Started Launch Pad |
27 |
| Available systems |
27 |
| CMC storage hierarchy |
28 |
| Icons |
28 |
| Using the tab window |
28 |
| Tab window conventions |
28 |
| Using the Map View tab |
29 |
| Manipulating the Map View |
29 |
| Using the display tools |
29 |
| Using views and layouts |
30 |
| Using the Alarms window |
30 |
| Setting preferences |
30 |
| Setting the font and locale |
30 |
| Setting naming conventions |
30 |
| Changing naming conventions |
31 |
| Creating storage by using the Getting Started Launch Pad |
33 |
| Prerequisites |
33 |
| Finding the storage systems |
33 |
| Configuring storage systems |
34 |
| Configure storage system categories |
34 |
| Creating a volume using the wizard |
34 |
| Enabling server access to volumes |
35 |
| Finding storage systems on an ongoing basis |
36 |
| Turn off Auto Discover by Broadcast for storage systems |
36 |
| Troubleshooting—Storage systems not found |
36 |
| Possible reasons for not finding storage systems |
36 |
| Changing which storage systems appear in the navigation window |
36 |
| CMC setup for remote support |
37 |
| 2 Working with storage systems |
39 |
| Storage system configuration categories |
39 |
| Storage system configuration category definitions |
39 |
| Storage system tasks |
39 |
| Working with the storage system |
40 |
| Logging in to and out of storage systems |
40 |
| Automatic login |
40 |
| Logging out of a storage system |
40 |
| Changing the storage system hostname |
40 |
| Locating the storage system in a rack |
41 |
| Backing up and restoring the storage system configuration |
41 |
| Backing up storage system does not save all settings |
41 |
| Manual configuration steps following the restore |
42 |
| Backing up the storage system configuration file |
42 |
| Restoring the storage system configuration from a file |
42 |
| Powering off or rebooting the storage system |
43 |
| Powering on or off, or rebooting storage systems with modular components |
43 |
| Rebooting the storage system |
44 |
| Powering off the storage system |
45 |
| Upgrading the SAN/iQ software on the storage system |
46 |
| Upgrading the CMC and storage systems |
46 |
| Setting upgrade preferences |
46 |
| Checking for available upgrades |
46 |
| Upgrading the CMC |
47 |
| Upgrading storage systems in a management group or available storage systems |
47 |
| Monitoring upgrade progress |
49 |
| Reviewing the upgrade summary |
49 |
| Registering advanced features for a storage system |
49 |
| Determining volume and snapshot availability |
49 |
| Checking status of dedicated boot devices |
50 |
| Checking boot device status |
50 |
| Getting there |
50 |
| Replacing a dedicated boot device |
51 |
| 3 Storage Configuration: Disk RAID and Disk Management |
53 |
| Configuring RAID and managing disks |
53 |
| Getting there |
53 |
| Status indicators |
53 |
| Configuring and managing RAID |
54 |
| RAID Levels |
54 |
| Explaining RAID devices in the RAID setup report |
55 |
| RAID devices by RAID type |
56 |
| Virtual RAID devices |
56 |
| Planning the RAID configuration |
56 |
| Data protection |
56 |
| Using RAID for data redundancy |
57 |
| Using Network RAID in a cluster |
57 |
| Using disk RAID with Network RAID in a cluster |
57 |
| Mixing RAID configurations |
58 |
| Setting RAID rebuild rate |
59 |
| General guidelines for setting the RAID rebuild rate |
59 |
| Setting the RAID rebuild rate |
59 |
| Reconfiguring RAID |
59 |
| To reconfigure RAID |
60 |
| Monitoring RAID status |
60 |
| Data reads and writes and RAID status |
60 |
| Data redundancy and RAID status |
60 |
| Managing disks |
61 |
| Getting there |
62 |
| Reading the disk report on the Disk Setup tab |
62 |
| Verifying disk status |
63 |
| Viewing disk status for the DL320s (NSM 2120) |
63 |
| Viewing disk status for the IBM x3650 |
64 |
| Viewing disk status for the VSA |
65 |
| Viewing disk status for the Dell 2950 and NSM 2060 |
66 |
| Viewing disk status for the NSM 4150 |
66 |
| Viewing disk status for the HP LeftHand P4500 and HP StorageWorks P4500 G2 |
67 |
| Viewing disk status for the HP LeftHand P4300 and HP StorageWorks P4300 G2 |
68 |
| Viewing disk status for the HP LeftHand P4800 and HP StorageWorks P4800 G2 |
69 |
| Replacing a disk |
70 |
| Using Repair Storage System |
71 |
| Replacing disks in hot-swap storage systems |
71 |
| Preparing for a disk replacement |
72 |
| To prepare for disk replacement |
72 |
| Identify physical location of storage system and disk |
72 |
| Best practice checklist for single disk replacement in RAID 0 |
73 |
| Best practice checklist for single disk replacement in RAID 1, RAID 10, RAID 5, RAID 50, and RAID 6 |
73 |
| Replacing a disk in RAID 0 |
73 |
| Manually power off the disk in the CMC for RAID 0 |
73 |
| Physically replace the disk drive in the storage system |
74 |
| Manually powering on the disk in the CMC |
74 |
| Volume restriping |
74 |
| Replacing a disk in a non-hot-swap storage system (IBM x3650) |
74 |
| Manually power off the disk in the CMC for RAID 1, RAID 10, and RAID 5 |
75 |
| Physically replace the disk drive in the storage system |
75 |
| Manually powering on the disk in the CMC |
75 |
| Manually powering on the disk in the IBM x3650 |
75 |
| RAID rebuilding |
76 |
| Replacing a disk in a hot-swap storage system |
76 |
| Replace the disk |
76 |
| Physically replace the disk drive in the storage system |
76 |
| RAID rebuilding |
77 |
| 4 Managing the network |
79 |
| Network best practices |
79 |
| Changing network configurations |
79 |
| Best practices when changing network characteristics |
79 |
| Getting there |
80 |
| Managing settings on network interfaces |
80 |
| Requirements |
80 |
| TCP status tab |
80 |
| Changing speed and duplex settings |
81 |
| Requirements |
82 |
| Best practice |
82 |
| To change the speed and duplex |
82 |
| Changing NIC frame size |
82 |
| Requirements |
82 |
| Best practices |
82 |
| Jumbo frames |
83 |
| Editing the NIC frame size |
83 |
| Changing NIC flow control |
84 |
| Requirements |
84 |
| Enabling NIC flow control |
84 |
| The TCP/IP tab |
85 |
| Identifying the network interfaces |
85 |
| Pinging an IP address |
85 |
| To ping an IP address |
85 |
| Configuring the IP address manually |
86 |
| Using DHCP |
86 |
| To set IP address using DHCP |
86 |
| Configuring network interface bonds |
87 |
| Best practices |
88 |
| IP address for NIC bonds |
88 |
| NIC bonding and speed, duplex, frame size, and flow control settings |
88 |
| How Active-Passive works |
88 |
| Physical and logical interfaces |
89 |
| Requirements for Active-Passive |
89 |
| Which physical interface is preferred |
89 |
| Summary of NIC status during failover |
90 |
| Example network cabling topologies with Active-Passive |
90 |
| How link aggregation dynamic mode works |
92 |
| Requirements for link aggregation dynamic mode |
92 |
| Which physical interface is preferred |
93 |
| Which physical interface is active |
93 |
| Summary of NIC states during failover |
93 |
| Example network cabling topologies with link aggregation dynamic mode |
94 |
| How Adaptive Load Balancing works |
94 |
| Requirements for Adaptive Load Balancing |
94 |
| Which physical interface is preferred |
94 |
| Which physical interface is active |
95 |
| Summary of NIC states during failover |
95 |
| Example network cabling topologies with Adaptive Load Balancing |
95 |
| Creating a NIC bond |
96 |
| Prerequisites |
96 |
| Bond guidelines |
96 |
| Creating the bond |
97 |
| Verify communication setting for new bond |
99 |
| Viewing the status of a NIC bond |
99 |
| Deleting a NIC bond |
101 |
| Verify NIC settings and communication settings after deleting a bond |
102 |
| Disabling a network interface |
102 |
| Disabling a network interface |
103 |
| If the storage system is in a management group |
103 |
| Configuring a disabled interface |
103 |
| Using a DNS server |
103 |
| DNS and DHCP |
104 |
| DNS and static IP addresses |
104 |
| Getting there |
104 |
| Adding the DNS domain name |
104 |
| Adding the DNS server |
104 |
| Adding domain names to the DNS suffixes |
105 |
| Editing a DNS server |
105 |
| Editing a domain name in the DNS suffixes list |
105 |
| Removing a DNS server |
105 |
| Removing a domain suffix from the DNS suffixes list |
106 |
| Setting up routing |
106 |
| Adding routing information |
106 |
| Editing routing information |
106 |
| Deleting routing information |
107 |
| Configuring storage system communication |
107 |
| Selecting the interface used by the SAN/iQ software |
107 |
| Updating the list of manager IP addresses |
108 |
| Requirements |
108 |
| 5 Setting the date and time |
111 |
| Management group time |
111 |
| Getting there |
111 |
| Refreshing the management group time |
111 |
| Using NTP |
112 |
| Editing NTP servers |
112 |
| Deleting an NTP server |
113 |
| Delete an NTP server |
113 |
| Changing the order of NTP servers |
113 |
| Editing the date and time |
113 |
| Editing the time zone only |
114 |
| 6 Administrative users and groups |
115 |
| Getting there |
115 |
| Managing administrative users |
115 |
| Default administrative user |
115 |
| Adding a new administrative user |
115 |
| Editing administrative users |
115 |
| Changing a user’s description |
116 |
| Changing a user’s password |
116 |
| Adding group membership to a user |
116 |
| Removing group membership from a user |
116 |
| Deleting an administrative user |
116 |
| Managing administrative groups |
117 |
| Default administrative groups |
117 |
| Adding administrative groups |
117 |
| What the permission levels mean |
118 |
| Editing administrative groups |
118 |
| Change the description of a group |
118 |
| Changing administrative group permissions |
118 |
| Adding users to an existing group |
119 |
| Removing users from a group |
119 |
| Deleting administrative groups |
119 |
| 7 Monitoring and reporting |
121 |
| Alarms and events overview |
121 |
| Working with alarms |
123 |
| Filtering the alarms list |
123 |
| Displaying alarm details |
124 |
| Displaying alarms in a separate window |
124 |
| Exporting alarm data |
124 |
| Working with events |
125 |
| Displaying new events |
125 |
| Filtering the events list |
125 |
| Saving filter views |
126 |
| Deleting custom filters |
126 |
| Displaying event details |
127 |
| Displaying events in a separate window |
127 |
| Copying events to the clipboard |
127 |
| Exporting event data |
128 |
| Setting up remote log destinations |
128 |
| Changing the event retention period |
128 |
| Event notification overview |
129 |
| Setting up email notification |
129 |
| Setting up the email server |
129 |
| Setting up email recipients |
129 |
| Setting up SNMP |
130 |
| Getting there |
130 |
| Enabling SNMP agents |
130 |
| Enabling the SNMP agent |
131 |
| Configuring access control for SNMP clients |
131 |
| Adding an SNMP client |
131 |
| Editing access control entries |
132 |
| Deleting access control entries |
132 |
| Disabling the SNMP agent |
132 |
| Disabling SNMP |
132 |
| Adding SNMP traps |
133 |
| Editing trap recipients |
133 |
| Removing trap recipients |
133 |
| Sending a test trap |
134 |
| Disabling SNMP traps |
134 |
| Using the SNMP MIBs |
134 |
| Installing the LeftHand Networks MIB |
134 |
| The supported MIBs |
135 |
| Using hardware information reports |
135 |
| Running diagnostic reports |
136 |
| Getting there |
136 |
| Viewing the diagnostic report |
136 |
| List of diagnostic tests |
137 |
| Using the hardware information report |
138 |
| Generating a hardware information report |
138 |
| Saving a hardware information report |
139 |
| Hardware information report details |
139 |
| Using hardware information log files |
141 |
| Saving log files |
141 |
| Using remote log files |
142 |
| Adding a remote log |
142 |
| Configuring the remote log target computer |
142 |
| Editing remote log targets |
143 |
| Deleting remote logs |
143 |
| System Summary |
143 |
| Exporting support logs |
144 |
| 8 Working with management groups |
145 |
| Functions of management groups |
145 |
| Guide for management groups |
145 |
| Creating a management group |
146 |
| Getting there |
146 |
| Creating a new management group |
146 |
| Create management group and add storage systems |
147 |
| Add administrative user |
147 |
| Set management group time |
147 |
| Set DNS server |
147 |
| Set up email for notification |
147 |
| Create cluster and assign a VIP |
147 |
| Create a volume and finish creating management group |
148 |
| Management group map view tab |
148 |
| Creating a management group and default managers |
148 |
| Managers overview |
149 |
| Functions of managers |
149 |
| Managers and quorum |
149 |
| Regular managers and specialized managers |
150 |
| Failover Managers |
150 |
| Virtual Managers |
151 |
| Configuration Summary overview |
151 |
| Summary roll-up |
151 |
| Configuration guidance |
152 |
| Best practices |
152 |
| Volumes and snapshots |
152 |
| iSCSI sessions |
152 |
| Storage systems in the management group |
153 |
| Storage systems in the cluster |
153 |
| Reading the configuration summary |
153 |
| Optimal configurations |
153 |
| Configuration warnings |
154 |
| Configuration errors |
154 |
| Best Practice summary overview |
155 |
| Disk level data protection |
156 |
| Disk protection using RAID |
156 |
| Large single-system SATA cluster |
156 |
| Cluster-level data protection |
156 |
| Volume-level data protection |
156 |
| Volume access |
156 |
| Systems running managers |
156 |
| Network speed and bandwidth |
156 |
| Management group maintenance tasks |
157 |
| Logging in to a management group |
157 |
| Choosing which storage system to log in to |
157 |
| Logging out of a management group |
157 |
| Adding a storage system to an existing management group |
158 |
| Starting and stopping managers |
158 |
| Starting additional managers |
158 |
| Stopping managers |
158 |
| Implications of stopping managers |
158 |
| Editing a management group |
159 |
| Setting or changing the local bandwidth priority |
159 |
| Local bandwidth priority settings |
159 |
| Set or change local bandwidth priority |
160 |
| Backing up a management group configuration |
160 |
| Backing up a management group with remote copy relationships |
160 |
| Back up a management group configuration |
160 |
| Restoring a management group |
161 |
| Safely shutting down a management group |
161 |
| Prerequisites |
161 |
| Shut down the management group |
161 |
| If volumes are still connected to servers or hosts |
161 |
| Start the management group back up |
162 |
| Restarted management group in maintenance mode |
162 |
| Manually change management group to normal mode |
162 |
| Removing a storage system from a management group |
163 |
| Prerequisites |
163 |
| Remove the storage system |
164 |
| Deleting a management group |
164 |
| Prerequisites |
164 |
| Delete the management group |
164 |
| Setting the management group version |
164 |
| 9 Using specialized managers |
165 |
| Definitions |
165 |
| Failover Manager overview |
165 |
| Failover Manager requirements |
165 |
| Minimum system requirements for using with VMware ESX Server |
165 |
| Planning the virtual network configuration |
166 |
| Upgrading the 7.0 Failover Manager |
166 |
| Using the Failover Manager on VMware ESX Server |
166 |
| Configuring the Failover Manager using the VI Client |
166 |
| Add Failover Manager to inventory |
166 |
| Select a network connection |
167 |
| Power on the Failover Manager and configure the IP address and host name |
167 |
| Setting the IP address |
167 |
| Finishing up with VI Client |
168 |
| Uninstalling the Failover Manager from VMware ESX Server |
168 |
| Troubleshooting the Failover Manager on ESX Server |
169 |
| Virtual manager overview |
169 |
| When to use a virtual manager |
170 |
| Disaster recovery using a virtual manager |
170 |
| Management group across two sites with shared data |
170 |
| Management group in a single location with two storage systems |
170 |
| Storage system maintenance using a virtual manager |
170 |
| Benefits of a virtual manager |
170 |
| Requirements for using a virtual manager |
170 |
| Configuring a cluster for disaster recovery |
172 |
| Best practice |
172 |
| Configuration steps |
172 |
| Adding a virtual manager |
174 |
| Starting a virtual manager to regain quorum |
174 |
| Starting a virtual manager |
175 |
| Verifying virtual manager status |
176 |
| Stopping a virtual manager |
176 |
| Removing a virtual manager |
176 |
| 10 Working with clusters |
177 |
| Clusters and storage system capacity |
177 |
| Prerequisites |
177 |
| Creating additional clusters |
177 |
| Prerequisites |
177 |
| Number of storage systems in clusters |
177 |
| To create additional clusters |
177 |
| Configure virtual IP and iSNS for iSCSI |
178 |
| Using Virtual IP addresses |
178 |
| Adding an iSNS server |
178 |
| Clusters Map View |
178 |
| Tracking cluster usage |
179 |
| Editing a cluster |
179 |
| Prerequisite |
179 |
| Getting there |
179 |
| Adding a new storage system to an existing cluster |
179 |
| Prerequisite |
180 |
| Storage systems and cluster capacity |
180 |
| Example |
180 |
| Adding storage to a cluster |
180 |
| Removing a storage system from a cluster |
180 |
| Changing or removing the virtual IP |
181 |
| Preparing servers |
181 |
| Changing the virtual IP address |
181 |
| Removing the virtual IP address |
181 |
| Finishing up |
181 |
| Changing or removing an iSNS server |
181 |
| Preparing clients |
182 |
| Changing an iSNS server |
182 |
| Deleting an iSNS server |
182 |
| Finishing up |
182 |
| Troubleshooting a cluster |
182 |
| Auto Performance Protection |
182 |
| Auto Performance Protection and the VSA |
183 |
| Auto Performance Protection and other clusters |
183 |
| Checking storage system status |
183 |
| If status is Storage Server Overloaded |
184 |
| If status is Storage Server Inoperable |
184 |
| If these statuses recur |
184 |
| Repairing a storage system |
184 |
| Prerequisites |
184 |
| How repair storage system works |
185 |
| Using the repair storage system command |
185 |
| To return the repaired storage system to the cluster |
186 |
| Deleting a cluster |
188 |
| Prerequisite |
188 |
| 11 Provisioning storage |
189 |
| Understanding how the capacity of the SAN is used |
189 |
| Provisioning storage |
189 |
| Provisioning volumes |
190 |
| Full provisioning |
190 |
| Thin provisioning |
190 |
| Best practice for setting volume size |
190 |
| Planning data protection |
190 |
| Former terminology in release 8.1 and earlier |
191 |
| Data protection level |
191 |
| How data protection levels work |
192 |
| Network RAID–10 (2–Way Mirror) |
192 |
| Network RAID-10+1 (3-Way Mirror) |
193 |
| Network RAID-10+1 (4-Way Mirror) |
193 |
| Network RAID-5 (Single Parity) |
194 |
| Network RAID-6 (Dual Parity) |
195 |
| Provisioning snapshots |
196 |
| Snapshots versus backups |
196 |
| The effect of snapshots on cluster space |
197 |
| Managing capacity using volume size and snapshots |
197 |
| Volume size and snapshots |
197 |
| Schedules to snapshot a volume and capacity |
197 |
| Deleting snapshots |
197 |
| Ongoing capacity management |
198 |
| Number of volumes and snapshots |
198 |
| Reviewing SAN capacity and usage |
198 |
| Cluster use summary |
198 |
| Volume use summary |
200 |
| System Use summary |
201 |
| Measuring disk capacity and volume size |
202 |
| Block systems and file systems |
202 |
| Storing file system data on a block system |
202 |
| Changing the volume size on the server |
203 |
| Increasing the volume size in Microsoft Windows |
203 |
| Increasing the volume size in other environments |
204 |
| Changing configuration characteristics to manage space |
204 |
| 12 Using volumes |
205 |
| Volumes and server access |
205 |
| Prerequisites |
205 |
| Planning volumes |
205 |
| Planning how many volumes |
205 |
| Planning volume types |
206 |
| Guide for volumes |
206 |
| Creating a volume |
208 |
| Creating a basic volume |
208 |
| Configuring advanced volume settings [optional] |
208 |
| Configuring advanced volume settings |
208 |
| Volumes map view |
209 |
| Editing a volume |
209 |
| To edit a volume |
210 |
| Changing the volume description |
210 |
| Changing the cluster |
210 |
| Requirement |
210 |
| Changing the data protection level |
211 |
| Changing the size |
211 |
| Deleting a volume |
211 |
| Restrictions on deleting volumes |
211 |
| Prerequisites |
212 |
| To delete the volume |
212 |
| To delete multiple volumes |
212 |
| 13 Using snapshots |
213 |
| Snapshots versus backups |
213 |
| Prerequisites |
213 |
| Using snapshots |
213 |
| Single snapshots versus scheduled snapshots |
214 |
| Guide for snapshots |
214 |
| Planning snapshots |
214 |
| Source volumes for tape backups |
215 |
| Data preservation before upgrading software |
215 |
| Automated backups |
215 |
| Planning how many snapshots |
215 |
| Creating a snapshot |
215 |
| Requirements for application-managed snapshots |
216 |
| Understanding snapshots for volume sets |
216 |
| Creating snapshots for volume sets |
217 |
| Editing a snapshot |
218 |
| Mounting or accessing a snapshot |
218 |
| Mounting the snapshot on a host |
218 |
| Making an application-managed snapshot available |
218 |
| Making an application-managed snapshot available on a stand-alone server |
219 |
| Making an application-managed snapshot available on a server in a Microsoft cluster |
220 |
| Managing snapshot temporary space |
221 |
| Convert the temporary space |
221 |
| Prerequisites |
221 |
| Delete the temporary space |
221 |
| Prerequisite |
221 |
| Creating a schedule to snapshot a volume |
222 |
| Best practices for scheduling snapshots of volumes |
222 |
| Creating schedules to snapshot a volume |
223 |
| Understanding schedules to snapshot volume sets |
224 |
| Editing scheduled snapshots |
225 |
| Pausing and resuming scheduled snapshots |
225 |
| Pause a schedule |
225 |
| Resume a schedule |
225 |
| Deleting schedules to snapshot a volume |
226 |
| Scripting snapshots |
226 |
| Rolling back a volume to a snapshot or clone point |
227 |
| Requirements for rolling back a volume |
227 |
| Restrictions on rolling back a volume |
227 |
| Prerequisite |
227 |
| Rolling back a volume to a snapshot or clone point |
227 |
| Continue with standard roll back |
228 |
| Create a new SmartClone volume from the snapshot |
229 |
| Roll back all associated volumes |
229 |
| Cancel the rollback operation |
230 |
| Deleting a snapshot |
230 |
| Restrictions on deleting snapshots |
230 |
| Prerequisites |
231 |
| Delete the snapshot |
231 |
| 14 SmartClone volumes |
233 |
| What are SmartClone volumes? |
233 |
| Prerequisites |
233 |
| SmartClone volume terminology |
233 |
| Example scenarios for using SmartClone volumes |
234 |
| Deploy multiple virtual or boot-from-SAN servers |
234 |
| Scenario: Computer training lab |
234 |
| Safely use production data for test, development, and data mining |
235 |
| Test and development |
235 |
| Data mining |
235 |
| Clone a volume |
235 |
| Planning SmartClone volumes |
235 |
| Space requirements |
235 |
| Naming convention for SmartClone volumes |
236 |
| Naming and multiple identical disks in a server |
236 |
| Server access |
236 |
| Defining SmartClone volume characteristics |
237 |
| Naming SmartClone volumes |
237 |
| Shared versus individual characteristics |
239 |
| Clone point |
242 |
| Shared snapshot |
244 |
| Creating SmartClone volumes |
246 |
| To create a SmartClone volume |
246 |
| Viewing SmartClone volumes |
248 |
| Map view |
248 |
| Using views |
249 |
| Viewing clone points, volumes, and snapshots |
250 |
| Editing SmartClone volumes |
251 |
| To edit the SmartClone volumes |
252 |
| Deleting SmartClone volumes |
252 |
| Deleting the clone point |
253 |
| Deleting multiple SmartClone volumes |
253 |
| 15 Working with scripting |
255 |
| Scripting documentation |
255 |
| 16 Controlling server access to volumes |
257 |
| Change in server access control from version 7.0 and earlier |
258 |
| Adding server connections to management groups |
258 |
| Prerequisites |
258 |
| Guide for servers |
259 |
| Adding a server connection |
259 |
| Managing server connections |
260 |
| Editing server connections |
260 |
| Deleting server connections |
260 |
| Clustering server connections |
261 |
| Requirements for clustering servers |
261 |
| Creating a server cluster |
261 |
| Server cluster map view |
263 |
| Working with a server cluster |
263 |
| Editing a server cluster |
263 |
| Deleting a server cluster |
264 |
| Assigning server connections access to volumes |
264 |
| Assigning server connections from a volume |
265 |
| Assigning volumes from a server connection |
266 |
| Editing server connection and volume assignments |
266 |
| Editing server connection assignments from a volume |
266 |
| Editing server assignments from a server connection |
266 |
| Completing the iSCSI Initiator and disk setup |
267 |
| Persistent targets or favorite targets |
267 |
| HP P4000 DSM for MPIO settings |
267 |
| Disk management |
267 |
| 17 Monitoring performance |
269 |
| Prerequisites |
269 |
| Introduction to using performance information |
269 |
| What can I learn about my SAN? |
270 |
| Current SAN activities example |
270 |
| Workload characterization example |
270 |
| Fault isolation example |
271 |
| What can I learn about my volumes? |
271 |
| Most active volumes examples |
271 |
| Activity generated by a specific server example |
272 |
| Planning for SAN improvements |
272 |
| Network utilization to determine if NIC bonding could improve performance example |
273 |
| Load comparison of two clusters example |
273 |
| Load comparison of two volumes example |
274 |
| Accessing and understanding the Performance Monitor window |
275 |
| Performance Monitor toolbar |
276 |
| Performance monitor graph |
277 |
| Performance monitor table |
277 |
| Understanding the performance statistics |
278 |
| Monitoring and comparing multiple clusters |
280 |
| Performance monitoring and analysis concepts |
281 |
| Workloads |
281 |
| Access type |
281 |
| Access size |
281 |
| Access pattern |
281 |
| Queue depth |
281 |
| Changing the sample interval and time zone |
281 |
| Adding statistics |
282 |
| Viewing statistic details |
284 |
| Removing and clearing statistics |
284 |
| Removing a statistic |
284 |
| Clearing the sample data |
284 |
| Clearing the display |
285 |
| Resetting defaults |
285 |
| Pausing and restarting monitoring |
285 |
| Changing the graph |
285 |
| Hiding and showing the graph |
286 |
| Displaying or hiding a line |
286 |
| Changing the color or style of a line |
286 |
| Highlighting a line |
286 |
| Changing the scaling factor |
286 |
| Exporting data |
287 |
| Exporting statistics to a CSV file |
287 |
| Saving the graph to an image file |
288 |
| 18 Registering advanced features |
289 |
| Evaluating advanced features |
289 |
| Evaluation period |
289 |
| Tracking the time remaining in the evaluation period |
289 |
| Viewing licensing icons |
289 |
| Starting the evaluation period |
290 |
| Backing out of Remote Copy evaluation |
290 |
| Scripting evaluation |
291 |
| Turn on scripting evaluation |
291 |
| Turn off scripting evaluation |
291 |
| Registering advanced features |
292 |
| Using license keys |
292 |
| Registering available storage systems for license keys |
292 |
| Submitting storage system feature keys |
293 |
| Entering license keys to storage systems |
293 |
| Registering storage systems in a management group |
294 |
| Submitting storage system feature keys |
294 |
| Entering license keys |
295 |
| Saving license key information |
296 |
| Saving and editing your customer information |
296 |
| Editing your customer information file |
297 |
| Saving your customer information |
297 |
| 19 iSCSI and the HP P4000 SAN Solution |
299 |
| Number of iSCSI sessions |
299 |
| Virtual IP addresses |
299 |
| Requirements for using a virtual IP address |
299 |
| iSNS server |
300 |
| iSCSI load balancing |
300 |
| Requirements |
300 |
| Compliant iSCSI initiators |
300 |
| Authentication (CHAP) |
300 |
| Requirements for configuring CHAP |
301 |
| iSCSI and CHAP terminology |
302 |
| Sample iSCSI configurations |
302 |
| Best practice |
304 |
| About HP DSM for MPIO |
304 |
| 20 Using the Configuration Interface |
305 |
| Connecting to the Configuration Interface |
305 |
| Establishing a terminal emulation session on a Windows system |
305 |
| Establishing a terminal emulation session on a Linux/UNIX system |
305 |
| Opening the Configuration Interface from the terminal emulation session |
306 |
| Logging in to the Configuration Interface |
306 |
| Configuring administrative users |
307 |
| Configuring a network connection |
307 |
| Deleting a NIC bond |
308 |
| Setting the TCP speed, duplex, and frame size |
308 |
| Removing a storage system from a management group |
309 |
| Resetting the storage system to factory defaults |
309 |
| 21 Support and other resources |
311 |
| Contacting HP |
311 |
| Subscription service |
311 |
| HP Insight Remote Support Software |
311 |
| New and changed information in this edition |
312 |
| Related information |
312 |
| HP websites |
312 |
| Typographic conventions |
312 |
| Customer self repair |
313 |
| HP product documentation survey |
314 |
| A Replacing disks reference |
315 |
| Replacing disks and rebuilding data |
315 |
| Before you begin |
315 |
| Prerequisites |
315 |
| Replacing disks |
316 |
| Verify storage system not running a manager |
316 |
| Stopping a manager |
316 |
| Repair the storage system |
316 |
| Prerequisite |
316 |
| Replace the disk |
317 |
| In IBM x3650 |
317 |
| In the DL320s (NSM 2120), Dell 2950, NSM 2060, NSM 4150, HP LeftHand P4500, HP LeftHand P4300 |
318 |
| Rebuilding data |
318 |
| Recreate the RAID array |
318 |
| Checking progress for RAID array to rebuild |
318 |
| Return storage system to cluster |
319 |
| Restarting a manager |
319 |
| Add repaired system to cluster |
320 |
| Rebuild volume data |
320 |
| Controlling server access |
321 |
| Change local bandwidth priority |
321 |
| Remove ghost storage system |
321 |
| Finishing up |
321 |
| B Third-party licenses |
323 |
| Glossary |
325 |
 1
1 271
271 272
272 273
273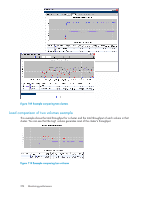 274
274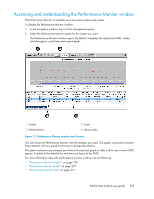 275
275 276
276 277
277 278
278 279
279 280
280 281
281