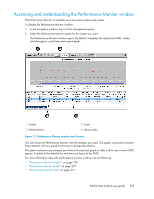
HP P4000 9.0 HP StorageWorks P4000 SAN Solution User Guide - Page 280
Monitoring and comparing multiple clusters, Volume, Cluster, Definition, Statistic, Open in Window
 |
View all HP P4000 manuals
Add to My Manuals
Save this manual to your list of manuals |
Page 280 highlights
Statistic Average I/O Size Queue Depth Reads Queue Depth Writes Queue Depth Total IO Latency Reads IO Latency Writes IO Latency Total Cache Hits Reads CPU Utilization Memory Utilization Network Utilization Network Bytes Read Network Bytes Write Network Bytes Total Storage Server Total Latency Definition Cluster Volume or Snapshot NSM Average read and write transfer size for the sample interval. X X X Number of outstanding read requests. X X - Number of outstanding write requests. X X - Number of outstanding read and write requests. X X X Average time, in milliseconds, to service read requests. X X X Average time, in milliseconds, to service write requests. X X X Average time, in milliseconds, to service read and write requests. X X X Percent of reads served from cache for the sample interval. X X - Percent of processor used on this storage system for the sample interval. - - X Percent of total memory used on this storage system for the sample interval. - - X Percent of bidirectional network capacity used on this network interface on this storage system for the - - X sample interval. Bytes read from the network for the sample interval. - - X Bytes written to the network for the sample interval. - - X Bytes read and written over the network for the sample interval. - - X Average time, in milliseconds, for the RAID controller to service read and write requests. - - X Monitoring and comparing multiple clusters You can open the Performance Monitor for a cluster in a separate window. This lets you monitor and compare multiple clusters at the same time. You can open one window per cluster and rearrange the windows to suit your needs. 1. From the Performance Monitor window, right-click anywhere, and select Open in Window. The Performance Monitor window opens as a separate window. Use the Performance Monitor Tasks menu to change the window settings. 2. When you no longer need the separate window, click Close. 280 Monitoring performance
-
 1
1 -
2
-
3
-
4
-
5
-
6
-
7
-
8
-
9
-
10
-
11
-
12
-
13
-
14
-
15
-
16
-
17
-
18
-
19
-
20
-
21
-
22
-
23
-
24
-
25
-
26
-
27
-
28
-
29
-
30
-
31
-
32
-
33
-
34
-
35
-
36
-
37
-
38
-
39
-
40
-
41
-
42
-
43
-
44
-
45
-
46
-
47
-
48
-
49
-
50
-
51
-
52
-
53
-
54
-
55
-
56
-
57
-
58
-
59
-
60
-
61
-
62
-
63
-
64
-
65
-
66
-
67
-
68
-
69
-
70
-
71
-
72
-
73
-
74
-
75
-
76
-
77
-
78
-
79
-
80
-
81
-
82
-
83
-
84
-
85
-
86
-
87
-
88
-
89
-
90
-
91
-
92
-
93
-
94
-
95
-
96
-
97
-
98
-
99
-
100
-
101
-
102
-
103
-
104
-
105
-
106
-
107
-
108
-
109
-
110
-
111
-
112
-
113
-
114
-
115
-
116
-
117
-
118
-
119
-
120
-
121
-
122
-
123
-
124
-
125
-
126
-
127
-
128
-
129
-
130
-
131
-
132
-
133
-
134
-
135
-
136
-
137
-
138
-
139
-
140
-
141
-
142
-
143
-
144
-
145
-
146
-
147
-
148
-
149
-
150
-
151
-
152
-
153
-
154
-
155
-
156
-
157
-
158
-
159
-
160
-
161
-
162
-
163
-
164
-
165
-
166
-
167
-
168
-
169
-
170
-
171
-
172
-
173
-
174
-
175
-
176
-
177
-
178
-
179
-
180
-
181
-
182
-
183
-
184
-
185
-
186
-
187
-
188
-
189
-
190
-
191
-
192
-
193
-
194
-
195
-
196
-
197
-
198
-
199
-
200
-
201
-
202
-
203
-
204
-
205
-
206
-
207
-
208
-
209
-
210
-
211
-
212
-
213
-
214
-
215
-
216
-
217
-
218
-
219
-
220
-
221
-
222
-
223
-
224
-
225
-
226
-
227
-
228
-
229
-
230
-
231
-
232
-
233
-
234
-
235
-
236
-
237
-
238
-
239
-
240
-
241
-
242
-
243
-
244
-
245
-
246
-
247
-
248
-
249
-
250
-
251
-
252
-
253
-
254
-
255
-
256
-
257
-
258
-
259
-
260
-
261
-
262
-
263
-
264
-
265
-
266
-
267
-
268
-
269
-
270
-
271
-
272
-
273
-
274
-
 275
275 -
 276
276 -
 277
277 -
 278
278 -
 279
279 -
 280
280 -
 281
281 -
 282
282 -
 283
283 -
 284
284 -
 285
285 -
286
-
287
-
288
-
289
-
290
-
291
-
292
-
293
-
294
-
295
-
296
-
297
-
298
-
299
-
300
-
301
-
302
-
303
-
304
-
305
-
306
-
307
-
308
-
309
-
310
-
311
-
312
-
313
-
314
-
315
-
316
-
317
-
318
-
319
-
320
-
321
-
322
-
323
-
324
-
325
-
326
-
327
-
328
-
329
-
330
-
331
-
332
-
333
-
334
-
335
-
336
-
337
-
338
-
339
-
340
-
341
-
342
-
343
-
344
-
345
-
346
-
347
-
348
-
349
-
350
 |
 |
