D-Link DGS-3200-16 User Manual - Page 199
Transmitted (TX), Transmitted TX window for Bytes and Packets
 |
UPC - 790069312007
View all D-Link DGS-3200-16 manuals
Add to My Manuals
Save this manual to your list of manuals |
Page 199 highlights
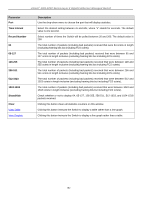
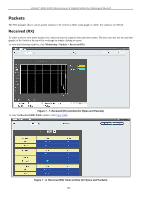
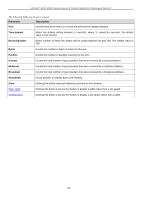
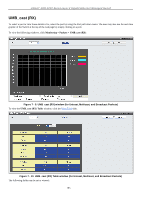
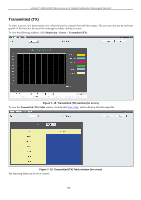
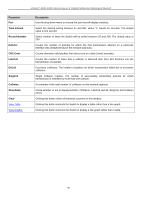
xStack® DGS-3200 Series Layer 2 Gigabit Ethernet Managed Switch Parameter Port Time Interval Record Number Unicast Multicast Broadcast Show/Hide Clear View Table View Graphic Description Use the drop-down menu to choose the port that will display statistics. Select the desired setting between 1s and 60s, where "s" stands for seconds. The default value is one second. Select number of times the Switch will be polled between 20 and 200. The default value is 200. Counts the total number of good packets that were received by a unicast address. Counts the total number of good packets that were received by a multicast address. Counts the total number of good packets that were received by a broadcast address. Check whether or not to display Multicast, Broadcast, and Unicast Packets. Clicking this button clears all statistics counters on this window. Clicking this button instructs the Switch to display a table rather than a line graph. Clicking this button instructs the Switch to display a line graph rather than a table. Transmitted (TX) To select a port to view these statistics for, select the port by using the Port pull-down menu. The user may also use the real-time graphic of the Switch at the top of the web page by simply clicking on a port. To view the following windows, click Monitoring > Packets > Transmitted (TX): Figure 7 - 11. Transmitted (TX) window (for Bytes and Packets) To view the Transmitted (TX) Table window, click the link View Table. 186
-
 1
1 -
2
-
3
-
4
-
5
-
6
-
7
-
8
-
9
-
10
-
11
-
12
-
13
-
14
-
15
-
16
-
17
-
18
-
19
-
20
-
21
-
22
-
23
-
24
-
25
-
26
-
27
-
28
-
29
-
30
-
31
-
32
-
33
-
34
-
35
-
36
-
37
-
38
-
39
-
40
-
41
-
42
-
43
-
44
-
45
-
46
-
47
-
48
-
49
-
50
-
51
-
52
-
53
-
54
-
55
-
56
-
57
-
58
-
59
-
60
-
61
-
62
-
63
-
64
-
65
-
66
-
67
-
68
-
69
-
70
-
71
-
72
-
73
-
74
-
75
-
76
-
77
-
78
-
79
-
80
-
81
-
82
-
83
-
84
-
85
-
86
-
87
-
88
-
89
-
90
-
91
-
92
-
93
-
94
-
95
-
96
-
97
-
98
-
99
-
100
-
101
-
102
-
103
-
104
-
105
-
106
-
107
-
108
-
109
-
110
-
111
-
112
-
113
-
114
-
115
-
116
-
117
-
118
-
119
-
120
-
121
-
122
-
123
-
124
-
125
-
126
-
127
-
128
-
129
-
130
-
131
-
132
-
133
-
134
-
135
-
136
-
137
-
138
-
139
-
140
-
141
-
142
-
143
-
144
-
145
-
146
-
147
-
148
-
149
-
150
-
151
-
152
-
153
-
154
-
155
-
156
-
157
-
158
-
159
-
160
-
161
-
162
-
163
-
164
-
165
-
166
-
167
-
168
-
169
-
170
-
171
-
172
-
173
-
174
-
175
-
176
-
177
-
178
-
179
-
180
-
181
-
182
-
183
-
184
-
185
-
186
-
187
-
188
-
189
-
190
-
191
-
192
-
193
-
 194
194 -
 195
195 -
 196
196 -
 197
197 -
 198
198 -
 199
199 -
 200
200 -
 201
201 -
 202
202 -
 203
203 -
 204
204 -
205
-
206
-
207
-
208
-
209
-
210
-
211
-
212
-
213
-
214
-
215
-
216
-
217
-
218
-
219
-
220
-
221
-
222
-
223
-
224
-
225
-
226
-
227
-
228
-
229
-
230
-
231
-
232
-
233
-
234
-
235
-
236
-
237
-
238
-
239
-
240
-
241
-
242
-
243
-
244
-
245
-
246
-
247
-
248
-
249
-
250
-
251
-
252
-
253
-
254
-
255
-
256
-
257
-
258
-
259
-
260
-
261
-
262
-
263
-
264
-
265
-
266
-
267
-
268
-
269
-
270
-
271
-
272
-
273
 |
 |