Garmin GPSMAP 6012 Owner's Manual - Page 19
Chart Setup, Navaid Type
 |
View all Garmin GPSMAP 6012 manuals
Add to My Manuals
Save this manual to your list of manuals |
Page 19 highlights
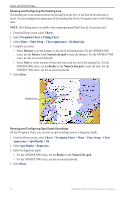
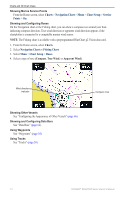
Charts and 3D Chart Views Configuring Depth Shading You can customize the appearance of depth shading on the Navigation chart. Note: Depth shading is available with a preprogrammed BlueChart g2 Vision data card. 1. From the Home screen, select Charts > Navigation Chart > Menu > Chart Setup > Chart Appearance > Safety Shading. 2. Select a depth. Areas with depths shallower than the specified value are shaded in blue, while areas with depths greater than the specified value are shaded in white. The contour is always drawn at, or deeper than, the selected depth. Showing and Configuring Navaid Symbols You can show and configure the appearance of navaid symbols on the Navigation chart or the Fishing chart. Note: The Fishing chart is available with a preprogrammed BlueChart g2 Vision data card. 1. From the Home screen, select Charts. 2. Complete an action: • Select Navigation Chart > Menu > Chart Setup > Chart Appearance > Symbols. • Select Fishing Chart > Menu > Chart Setup > Chart Appearance. 3. Complete an action: • Select Navaid Size to set the size of the navaid symbols shown on the map. Select a size. • Select Navaid Type > NOAA to show the NOAA navaid symbol set on the map. • Select Navaid Type > IALA to show the IALA navaid symbol set on the map. Showing Additional Chart Details You can show additional information on the Navigation chart. 1. From the Home screen, select Charts > Navigation Chart > Menu > Chart Setup > Chart Appearance > Symbols. 2. Complete an action: • Select Land POIs > On to show land-based points of interest (POIs). • Select Light Sectors to show the sector in which a navigational light is visible. Select On to show light sectors at all times, or select Auto to allow the chartplotter to automatically filter out light sectors depending on the zoom level. • Select Chart Borders > On to show the area the maps cover when using a BlueChart g2 Vision data card. • Select Photo Points > On to show camera icons when using a BlueChart g2 Vision data card. This enables you to view aerial photos of landmarks (page 26). GPSMAP® 6000/7000 Series Owner's Manual 13
-
 1
1 -
2
-
3
-
4
-
5
-
6
-
7
-
8
-
9
-
10
-
11
-
12
-
13
-
 14
14 -
 15
15 -
 16
16 -
 17
17 -
 18
18 -
 19
19 -
 20
20 -
 21
21 -
 22
22 -
 23
23 -
 24
24 -
25
-
26
-
27
-
28
-
29
-
30
-
31
-
32
-
33
-
34
-
35
-
36
-
37
-
38
-
39
-
40
-
41
-
42
-
43
-
44
-
45
-
46
-
47
-
48
-
49
-
50
-
51
-
52
-
53
-
54
-
55
-
56
-
57
-
58
-
59
-
60
-
61
-
62
-
63
-
64
-
65
-
66
-
67
-
68
-
69
-
70
-
71
-
72
-
73
-
74
-
75
-
76
-
77
-
78
-
79
-
80
-
81
-
82
-
83
-
84
-
85
-
86
-
87
-
88
-
89
-
90
-
91
-
92
-
93
-
94
-
95
-
96
-
97
-
98
-
99
-
100
-
101
-
102
-
103
-
104
-
105
-
106
-
107
-
108
-
109
-
110
-
111
-
112
-
113
-
114
-
115
-
116
-
117
-
118
-
119
-
120
-
121
-
122
-
123
-
124
-
125
-
126
-
127
-
128
-
129
-
130
-
131
-
132
 |
 |