Garmin GPSMAP 6012 Owner's Manual - Page 70
Charts, Data Bars, Navigation, Data Bar Setup, Route Leg, Next Turn, Distance, Destination
 |
View all Garmin GPSMAP 6012 manuals
Add to My Manuals
Save this manual to your list of manuals |
Page 70 highlights
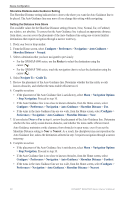
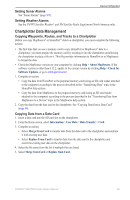
Device Configuration Configuring the Navigation Data Bar You should show the navigation data bar before you configure it (page 63). 1. From the Home screen, select Charts. 2. Select a chart or a 3D chart view. 3. Select Menu > Data Bars > Navigation > Data Bar Setup. 4. Complete an action: • Select Route Leg. Select On to show waypoint velocity made good (VMG) when navigating a route or an Auto Guidance line (page 65). • Select Next Turn > Distance to show next turn data based on distance. • Select Next Turn > Time to show next turn data based on time. • Select Destination, and select Distance, Time to Destination, or Arrival to indicate how the destination data appears. Fishing, Fuel, and Sailing Data Bars Data Bar Fishing Fuel Sailing Data Shown Depth, water temperature, and water speed Fuel rate, remaining fuel, range, and fuel economy Water speed, wind speed, wind angle, and wind velocity made good Showing the Fishing, Fuel, or Sailing Data Bars The fishing, fuel, and sailing data bars appear in a row across the bottom of the chart. Only one of these three data bars can appear at a time. 1. From the Home screen, select Charts. 2. Select a chart or a 3D chart view. 3. Complete an action: • Select Menu > Data Bars > Fishing > On. • Select Menu > Data Bars > Fuel > On. • Select Menu > Data Bars > Sailing > On. Note: When you show any one of these three data bars, the other two data bars are hidden automatically. Setting True or Apparent Wind for the Sailing Data Bar You should show the sailing data bar before you configure it (page 64). You can select the type of wind data that appears in the sailing data bar. 1. From the Home screen, select Charts. 2. Select a chart or a 3D chart view. 3. Select Menu > Data Bars > Sailing. 4. Complete an action: • Select Wind > Apparent to show the flow of air experienced while on a boat in motion. • Select Wind > True to show the flow of air experienced while on a stationary boat. 64 GPSMAP® 6000/7000 Series Owner's Manual
-
 1
1 -
2
-
3
-
4
-
5
-
6
-
7
-
8
-
9
-
10
-
11
-
12
-
13
-
14
-
15
-
16
-
17
-
18
-
19
-
20
-
21
-
22
-
23
-
24
-
25
-
26
-
27
-
28
-
29
-
30
-
31
-
32
-
33
-
34
-
35
-
36
-
37
-
38
-
39
-
40
-
41
-
42
-
43
-
44
-
45
-
46
-
47
-
48
-
49
-
50
-
51
-
52
-
53
-
54
-
55
-
56
-
57
-
58
-
59
-
60
-
61
-
62
-
63
-
64
-
 65
65 -
 66
66 -
 67
67 -
 68
68 -
 69
69 -
 70
70 -
 71
71 -
 72
72 -
 73
73 -
 74
74 -
 75
75 -
76
-
77
-
78
-
79
-
80
-
81
-
82
-
83
-
84
-
85
-
86
-
87
-
88
-
89
-
90
-
91
-
92
-
93
-
94
-
95
-
96
-
97
-
98
-
99
-
100
-
101
-
102
-
103
-
104
-
105
-
106
-
107
-
108
-
109
-
110
-
111
-
112
-
113
-
114
-
115
-
116
-
117
-
118
-
119
-
120
-
121
-
122
-
123
-
124
-
125
-
126
-
127
-
128
-
129
-
130
-
131
-
132
 |
 |