3Com 3C63311 Reference Guide - Page 214
Viewing Virtual Circuit Statistics by Port/Group, 2] Manage Circuits
 |
View all 3Com 3C63311 manuals
Add to My Manuals
Save this manual to your list of manuals |
Page 214 highlights
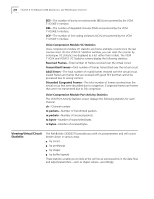
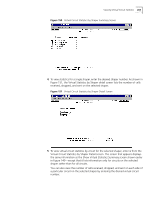
202 CHAPTER 5: PATHBUILDER S330 DIAGNOSTICS AND PERFORMANCE STATISTICS Row 2 (left to right) n cells received on side A n cells dropped on side A n cells received on side B n cells dropped on side B To view additional information about a particular circuit, enter the desired virtual circuit number. In addition to the information displayed on the summary screen, the Virtual Circuit Statistics Detail screen displays the number of cells sent on each side of the selected circuit. Viewing Virtual Circuit To display statistics for all virtual statistics by port/group, follow these steps: Statistics by Port/Group 1 From the Configuration Management menu, select [2] Manage Circuits to display the Virtual Circuit menu. 2 From the Virtual Circuit menu, select [6] Show Virtual Statistics by Port/Group to view a summary of statistics for all circuits on each port/group. The Port/Group Virtual Statistics summary screen displays the following information for each port/group: Port/Group-Card type and port/group number. rcvd from-Number of cells received dropped-Number of received cells dropped rcvd for-Number of cells sent dropped-Number of sent cells dropped To view the number of cells received, dropped, and sent from and to a particular port/group, enter the desired port/group number. Viewing Virtual Circuit To display virtual circuit statistics by shaper, follow these steps: Statistics by Shaper 1 From the Configuration Management menu, select [1] Manage Card to display the List Card menu. 2 Select [2] CTX to display the CTX menu. 3 From the CTX menu, select [4] VC Statistics by Shaper to display counts of cells sent and cells dropped for each shaper, as shown in Figure 150.
-
 1
1 -
2
-
3
-
4
-
5
-
6
-
7
-
8
-
9
-
10
-
11
-
12
-
13
-
14
-
15
-
16
-
17
-
18
-
19
-
20
-
21
-
22
-
23
-
24
-
25
-
26
-
27
-
28
-
29
-
30
-
31
-
32
-
33
-
34
-
35
-
36
-
37
-
38
-
39
-
40
-
41
-
42
-
43
-
44
-
45
-
46
-
47
-
48
-
49
-
50
-
51
-
52
-
53
-
54
-
55
-
56
-
57
-
58
-
59
-
60
-
61
-
62
-
63
-
64
-
65
-
66
-
67
-
68
-
69
-
70
-
71
-
72
-
73
-
74
-
75
-
76
-
77
-
78
-
79
-
80
-
81
-
82
-
83
-
84
-
85
-
86
-
87
-
88
-
89
-
90
-
91
-
92
-
93
-
94
-
95
-
96
-
97
-
98
-
99
-
100
-
101
-
102
-
103
-
104
-
105
-
106
-
107
-
108
-
109
-
110
-
111
-
112
-
113
-
114
-
115
-
116
-
117
-
118
-
119
-
120
-
121
-
122
-
123
-
124
-
125
-
126
-
127
-
128
-
129
-
130
-
131
-
132
-
133
-
134
-
135
-
136
-
137
-
138
-
139
-
140
-
141
-
142
-
143
-
144
-
145
-
146
-
147
-
148
-
149
-
150
-
151
-
152
-
153
-
154
-
155
-
156
-
157
-
158
-
159
-
160
-
161
-
162
-
163
-
164
-
165
-
166
-
167
-
168
-
169
-
170
-
171
-
172
-
173
-
174
-
175
-
176
-
177
-
178
-
179
-
180
-
181
-
182
-
183
-
184
-
185
-
186
-
187
-
188
-
189
-
190
-
191
-
192
-
193
-
194
-
195
-
196
-
197
-
198
-
199
-
200
-
201
-
202
-
203
-
204
-
205
-
206
-
207
-
208
-
 209
209 -
 210
210 -
 211
211 -
 212
212 -
 213
213 -
 214
214 -
 215
215 -
 216
216 -
 217
217 -
 218
218 -
 219
219 -
220
-
221
-
222
-
223
-
224
-
225
-
226
-
227
-
228
-
229
-
230
-
231
-
232
-
233
-
234
-
235
-
236
-
237
-
238
-
239
-
240
-
241
-
242
-
243
-
244
-
245
-
246
-
247
-
248
-
249
-
250
-
251
-
252
-
253
-
254
-
255
-
256
-
257
-
258
-
259
-
260
-
261
-
262
 |
 |
