Canon CanoScan FB 1200S Printing Guide - Page 41
To adjust the tones using the Histogram tool, Do one of the following to change the black point
 |
View all Canon CanoScan FB 1200S manuals
Add to My Manuals
Save this manual to your list of manuals |
Page 41 highlights
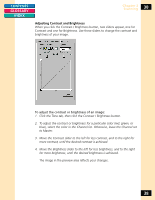
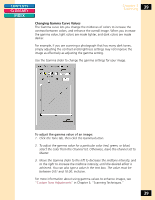
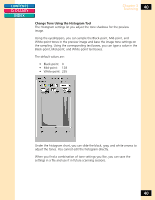
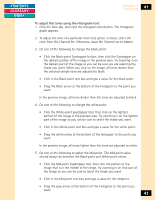
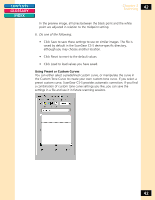
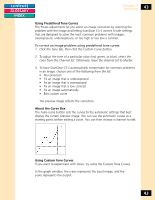
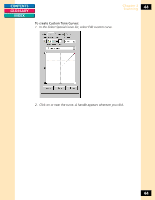
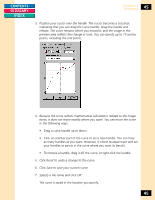
CONTENTS GLOSSARY INDEX Chapter 3 Scanning 41 To adjust the tones using the Histogram tool: 1. Click the Tone tab, then click the Histogram tool button. The Histogram graph appears. 2. To adjust the tone of a particular color (red, green, or blue), select the color from the Channel list. Otherwise, leave the Channel set to Master. 3. Do one of the following to change the black point: • Click the Black-point Eyedropper button, then click the Eyedropper on the darkest portion of the image in the preview area. Try zooming in on the darkest part of the image so you can be sure you are selecting the shade you want. When you click on the image, all tones darker than the selected sample tone are adjusted to black. • Click in the Black-point text box and type a value for the black point. • Drag the Black arrow at the bottom of the histogram to the point you want. In the preview image, all tones darker than this tone are adjusted to black. 4. Do one of the following to change the white point: • Click the White-point Eyedropper tool, then click on the lightest portion of the image in the preview area. Try zooming in on the lightest part of the image so you can be sure to select the shade you want. • Click in the White-point text box and type a value for the white point. • Drag the white arrow at the bottom of the histogram to the point you want. In the preview image, all tones lighter than this tone are adjusted to white. 5. Do one of the following to adjust the Mid-point. The Mid-point value should always be between the Black-point and White-point values. • Click the Mid-point Eyedropper tool, then click the portion of the image that is in the middle of the range. Try zooming in on that part of the image so you can be sure to select the shade you want. • Click in the Mid-point text box and type a value for the midpoint. • Drag the gray arrow at the bottom of the histogram to the point you want. 41
-
 1
1 -
2
-
3
-
4
-
5
-
6
-
7
-
8
-
9
-
10
-
11
-
12
-
13
-
14
-
15
-
16
-
17
-
18
-
19
-
20
-
21
-
22
-
23
-
24
-
25
-
26
-
27
-
28
-
29
-
30
-
31
-
32
-
33
-
34
-
35
-
 36
36 -
 37
37 -
 38
38 -
 39
39 -
 40
40 -
 41
41 -
 42
42 -
 43
43 -
 44
44 -
 45
45 -
 46
46 -
47
-
48
-
49
-
50
-
51
-
52
-
53
-
54
-
55
-
56
-
57
-
58
-
59
-
60
-
61
-
62
-
63
-
64
-
65
-
66
-
67
-
68
-
69
-
70
-
71
-
72
-
73
-
74
-
75
-
76
-
77
-
78
-
79
-
80
-
81
-
82
-
83
-
84
-
85
-
86
-
87
-
88
-
89
-
90
-
91
-
92
-
93
-
94
-
95
-
96
-
97
-
98
-
99
-
100
-
101
-
102
-
103
-
104
-
105
-
106
-
107
-
108
-
109
-
110
-
111
-
112
-
113
-
114
-
115
 |
 |