Lantronix X300 Series X300 Series User Guide Rev B - Page 59
Connection, Status > Realtime Graphs > Connection
 |
View all Lantronix X300 Series manuals
Add to My Manuals
Save this manual to your list of manuals |
Page 59 highlights
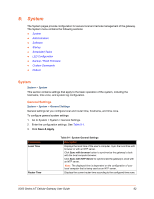
Figure 7-4 Realtime Wireless Usage Graph (client) 7: Status Connection Status > Realtime Graphs > Connection The Connection graph indicates the number of active network connections (x-axis) over time (yaxis). It includes connections originating from the gateway and also connections originating from the LAN or WAN. The graph displays UDP (blue), TCP (green) and other (red) connections. The table below the graph displays connection details including IPv4/IPv6, protocol, source IP, destination IP, and amount of data transferred. By default DNS lookup is disabled. You can enable it by clicking the link Enable DNS lookups below the graph. X300 Series IoT Cellular Gateway User Guide 59
-
 1
1 -
2
-
3
-
4
-
5
-
6
-
7
-
8
-
9
-
10
-
11
-
12
-
13
-
14
-
15
-
16
-
17
-
18
-
19
-
20
-
21
-
22
-
23
-
24
-
25
-
26
-
27
-
28
-
29
-
30
-
31
-
32
-
33
-
34
-
35
-
36
-
37
-
38
-
39
-
40
-
41
-
42
-
43
-
44
-
45
-
46
-
47
-
48
-
49
-
50
-
51
-
52
-
53
-
 54
54 -
 55
55 -
 56
56 -
 57
57 -
 58
58 -
 59
59 -
 60
60 -
 61
61 -
 62
62 -
 63
63 -
 64
64 -
65
-
66
-
67
-
68
-
69
-
70
-
71
-
72
-
73
-
74
-
75
-
76
-
77
-
78
-
79
-
80
-
81
-
82
-
83
-
84
-
85
-
86
-
87
-
88
-
89
-
90
-
91
-
92
-
93
-
94
-
95
-
96
-
97
-
98
-
99
-
100
-
101
-
102
-
103
-
104
-
105
-
106
-
107
-
108
-
109
-
110
-
111
-
112
-
113
-
114
-
115
-
116
-
117
-
118
-
119
-
120
-
121
-
122
-
123
-
124
-
125
-
126
-
127
-
128
-
129
-
130
-
131
-
132
-
133
-
134
-
135
-
136
-
137
-
138
-
139
-
140
-
141
-
142
-
143
-
144
-
145
-
146
-
147
-
148
-
149
-
150
-
151
-
152
-
153
-
154
-
155
-
156
-
157
-
158
-
159
-
160
-
161
-
162
-
163
-
164
-
165
-
166
-
167
-
168
-
169
-
170
-
171
-
172
-
173
-
174
-
175
-
176
-
177
-
178
-
179
-
180
-
181
-
182
-
183
-
184
-
185
-
186
-
187
-
188
-
189
-
190
-
191
-
192
-
193
-
194
-
195
-
196
-
197
-
198
-
199
-
200
-
201
-
202
-
203
-
204
-
205
-
206
-
207
-
208
-
209
-
210
-
211
-
212
-
213
-
214
-
215
-
216
 |
 |

7: Status
X300 Series IoT Cellular Gateway User Guide
59
Figure 7-4
Realtime Wireless Usage Graph (client)
Connection
Status > Realtime Graphs > Connection
The Connection graph indicates the number of active network connections (x-axis) over time (y-
axis). It includes connections originating from the gateway and also connections originating from
the LAN or WAN.
The graph displays UDP (blue), TCP (green) and other (red) connections. The table below the
graph displays connection details including IPv4/IPv6, protocol, source IP, destination IP, and
amount of data transferred.
By default DNS lookup is disabled. You can enable it by clicking the link
Enable DNS lookups
below the graph.