Dell PowerVault MD3200 Owner's Manual - Page 56
Start, Update, Save As, File name, Report format, Comma Delimited Format, Table 4-3.
 |
View all Dell PowerVault MD3200 manuals
Add to My Manuals
Save this manual to your list of manuals |
Page 56 highlights
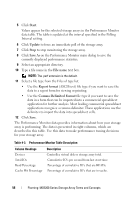
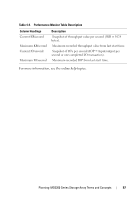
5 Click Start. Values appear for the selected storage arrays in the Performance Monitor data table. The table is updated at the interval specified in the Polling Interval setting. 6 Click Update to force an immediate poll of the storage array. 7 Click Stop to stop monitoring the storage array. 8 Click Save As on the Performance Monitor main dialog to save the currently displayed performance statistics. 9 Select an appropriate directory. 10 Type a file name in the File name text box. NOTE: The .perf extension is the default. 11 Select a file type from the Files of type list. • Use the Report format (ASCII text) file type if you want to save the data to a report form for viewing or printing. • Use the Comma Delimited Format file type if you want to save the data in a form that can be imported into a commercial spreadsheet application for further analysis. Most leading commercial spreadsheet applications recognize a comma delimiter. These applications use the delimiter to import the data into spreadsheet cells. 12 Click Save. The Performance Monitor data provides information about how your storage array is performing. The data is presented in eight columns, which are described in this table. Use this data to make performance tuning decisions for your storage array. Table 4-3. Performance Monitor Table Description Column Headings Devices Total IOs Read Percentage Cache Hit Percentage Description Controller, virtual disk or storage array total. Cumulative IO's per second from last start time. Percentage of cumulative IO's that are READs. Percentage of cumulative IO's that are in-cache. 56 Planning: MD3200 Series Storage Array Terms and Concepts
-
 1
1 -
2
-
3
-
4
-
5
-
6
-
7
-
8
-
9
-
10
-
11
-
12
-
13
-
14
-
15
-
16
-
17
-
18
-
19
-
20
-
21
-
22
-
23
-
24
-
25
-
26
-
27
-
28
-
29
-
30
-
31
-
32
-
33
-
34
-
35
-
36
-
37
-
38
-
39
-
40
-
41
-
42
-
43
-
44
-
45
-
46
-
47
-
48
-
49
-
50
-
 51
51 -
 52
52 -
 53
53 -
 54
54 -
 55
55 -
 56
56 -
 57
57 -
 58
58 -
 59
59 -
 60
60 -
 61
61 -
62
-
63
-
64
-
65
-
66
-
67
-
68
-
69
-
70
-
71
-
72
-
73
-
74
-
75
-
76
-
77
-
78
-
79
-
80
-
81
-
82
-
83
-
84
-
85
-
86
-
87
-
88
-
89
-
90
-
91
-
92
-
93
-
94
-
95
-
96
-
97
-
98
-
99
-
100
-
101
-
102
-
103
-
104
-
105
-
106
-
107
-
108
-
109
-
110
-
111
-
112
-
113
-
114
-
115
-
116
-
117
-
118
-
119
-
120
-
121
-
122
-
123
-
124
-
125
-
126
-
127
-
128
-
129
-
130
-
131
-
132
-
133
-
134
-
135
-
136
-
137
-
138
-
139
-
140
-
141
-
142
-
143
-
144
-
145
-
146
-
147
-
148
-
149
-
150
-
151
-
152
-
153
-
154
-
155
-
156
-
157
-
158
-
159
-
160
-
161
-
162
-
163
-
164
-
165
-
166
-
167
-
168
-
169
-
170
-
171
-
172
-
173
-
174
-
175
-
176
-
177
-
178
-
179
-
180
-
181
-
182
-
183
-
184
-
185
-
186
-
187
-
188
-
189
-
190
-
191
-
192
-
193
-
194
-
195
-
196
-
197
-
198
-
199
-
200
-
201
-
202
-
203
-
204
-
205
-
206
-
207
-
208
-
209
-
210
-
211
-
212
-
213
-
214
-
215
-
216
-
217
-
218
-
219
-
220
-
221
-
222
-
223
-
224
-
225
-
226
-
227
-
228
-
229
-
230
-
231
-
232
-
233
-
234
-
235
-
236
-
237
-
238
-
239
-
240
-
241
-
242
-
243
-
244
-
245
-
246
-
247
-
248
-
249
-
250
-
251
-
252
-
253
-
254
-
255
-
256
-
257
-
258
-
259
-
260
 |
 |