HP 6125G HP 6125G & 6125G/XG Blade Switches Network Management and Mon - Page 73
Configuring RMON, Overview, Working mechanism, RMON groups, Ethernet statistics group
 |
View all HP 6125G manuals
Add to My Manuals
Save this manual to your list of manuals |
Page 73 highlights
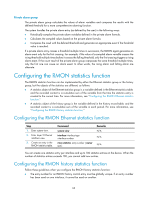
Configuring RMON This chapter describes how to configure RMON. Overview Remote Monitoring (RMON) is an enhancement to SNMP for remote device management and traffic monitoring. An RMON monitor, typically the RMON agent embedded in a network device, periodically or continuously collects traffic statistics for the network attached to a port, and when a statistic crosses a threshold, logs the crossing event and sends a trap to the management station. RMON uses SNMP traps to notify NMSs of exceptional conditions. RMON SNMP traps report various events, including traffic events such as broadcast traffic threshold exceeded. In contrast, SNMP standard traps report device operating status changes such as link up, link down, and module failure. RMON enables proactive monitoring and management of remote network devices and subnets. The managed device can automatically send a trap when a statistic crosses an alarm threshold, and the NMS does not need to constantly poll MIB variables and compare the results. As a result, network traffic is reduced. Working mechanism RMON monitors typically take one of the following forms: • Dedicated RMON probes. NMSs can obtain management information from RMON probes directly and control network resources. In this approach, NMSs can obtain all RMON MIB information. • RMON agents embedded in network devices. NMSs exchange data with RMON agents by using basic SNMP operations to gather network management information. Because this approach is resource intensive, most RMON agent implementations provide only four groups of MIB information: alarm, event, history, and statistics. HP devices provide the embedded RMON agent function. You can configure your device to collect and report traffic statistics, error statistics, and performance statistics. RMON groups Among the RFC 2819 defined RMON groups, HP implements the statistics group, history group, event group, and alarm group supported by the public MIB. HP also implements a private alarm group, which enhances the standard alarm group. Ethernet statistics group The statistics group defines that the system collects traffic statistics on interfaces (only Ethernet interfaces are supported) and saves the statistics in the Ethernet statistics table (ethernetStatsTable). The interface traffic statistics include network collisions, CRC alignment errors, undersize/oversize packets, broadcasts, multicasts, bytes received, and packets received. After you create a statistics entry for an interface, the statistics group starts to collect traffic statistics on the interface. The statistics in the Ethernet statistics table are cumulative sums. 66
-
 1
1 -
2
-
3
-
4
-
5
-
6
-
7
-
8
-
9
-
10
-
11
-
12
-
13
-
14
-
15
-
16
-
17
-
18
-
19
-
20
-
21
-
22
-
23
-
24
-
25
-
26
-
27
-
28
-
29
-
30
-
31
-
32
-
33
-
34
-
35
-
36
-
37
-
38
-
39
-
40
-
41
-
42
-
43
-
44
-
45
-
46
-
47
-
48
-
49
-
50
-
51
-
52
-
53
-
54
-
55
-
56
-
57
-
58
-
59
-
60
-
61
-
62
-
63
-
64
-
65
-
66
-
67
-
 68
68 -
 69
69 -
 70
70 -
 71
71 -
 72
72 -
 73
73 -
 74
74 -
 75
75 -
 76
76 -
 77
77 -
 78
78 -
79
-
80
-
81
-
82
-
83
-
84
-
85
-
86
-
87
-
88
-
89
-
90
-
91
-
92
-
93
-
94
-
95
-
96
-
97
-
98
-
99
-
100
-
101
-
102
-
103
-
104
-
105
-
106
-
107
-
108
-
109
-
110
-
111
-
112
-
113
-
114
-
115
-
116
-
117
-
118
-
119
-
120
-
121
-
122
-
123
-
124
-
125
-
126
-
127
-
128
-
129
-
130
-
131
-
132
-
133
-
134
-
135
-
136
-
137
-
138
-
139
-
140
-
141
-
142
-
143
-
144
-
145
-
146
-
147
-
148
-
149
-
150
-
151
-
152
-
153
-
154
-
155
-
156
-
157
 |
 |
