Canon CanoScan FB 1200S User Guide - Page 74
Interpreting a Histogram, How to Adjust a Histogram, Image 3
 |
View all Canon CanoScan FB 1200S manuals
Add to My Manuals
Save this manual to your list of manuals |
Page 74 highlights
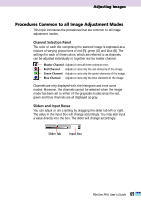
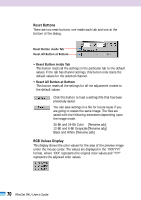
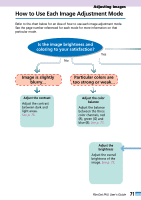
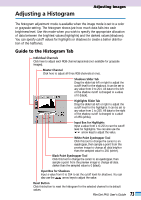
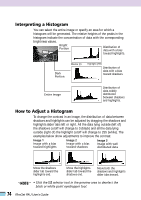
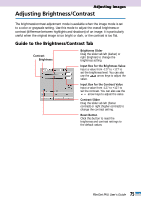
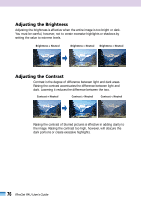
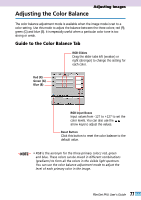
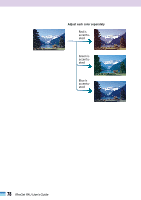
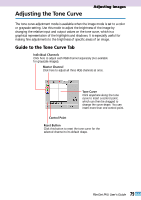
Interpreting a Histogram You can select the entire image or specify an area for which a histogram will be generated. The relative heights of the peaks in the histogram indicate the concentration of data with the corresponding brightness values. Bright Portion Distribution of data with a bias toward highlights. Dark Portion Shadow (0) Highlight (255) Distribution of data with a bias toward shadows. Entire Image Distribution of data widely distributed between shadows and highlights. How to Adjust a Histogram To change the contrast in an image, the distribution of data between shadows and highlights can be adjusted by dragging the shadows and highlights slider tabs left or right. All the data lying outside (left of) the shadows cutoff will change to 0 (black) and all the data lying outside (right of) the highlight cutoff will change to 255 (white). The examples below show adjustments to improve the contrast. Image 1 Image with a bias toward highlights Image 2 Image with a bias toward shadows Image 3 Image with well distributed data Move the shadows slider tab toward the highlights end. Move the highlights slider tab toward the shadows end. Move both the shadows and highlights slider tabs inward. • NOTE • • Click the selector tool in the preview area to deselect the black or white point eyedropper tool. 74 FilmGet FAU User's Guide
-
 1
1 -
2
-
3
-
4
-
5
-
6
-
7
-
8
-
9
-
10
-
11
-
12
-
13
-
14
-
15
-
16
-
17
-
18
-
19
-
20
-
21
-
22
-
23
-
24
-
25
-
26
-
27
-
28
-
29
-
30
-
31
-
32
-
33
-
34
-
35
-
36
-
37
-
38
-
39
-
40
-
41
-
42
-
43
-
44
-
45
-
46
-
47
-
48
-
49
-
50
-
51
-
52
-
53
-
54
-
55
-
56
-
57
-
58
-
59
-
60
-
61
-
62
-
63
-
64
-
65
-
66
-
67
-
68
-
 69
69 -
 70
70 -
 71
71 -
 72
72 -
 73
73 -
 74
74 -
 75
75 -
 76
76 -
 77
77 -
 78
78 -
 79
79 -
80
-
81
-
82
-
83
-
84
-
85
-
86
-
87
-
88
-
89
-
90
-
91
-
92
-
93
-
94
-
95
-
96
-
97
-
98
-
99
-
100
-
101
-
102
-
103
-
104
-
105
-
106
-
107
-
108
-
109
-
110
-
111
-
112
 |
 |