Canon CanoScan FB 1200S User Guide - Page 80
Interpreting Tone Curves, Adjusting a Tone Curve, Convex Curve, Concave, Curve
 |
View all Canon CanoScan FB 1200S manuals
Add to My Manuals
Save this manual to your list of manuals |
Page 80 highlights
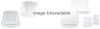
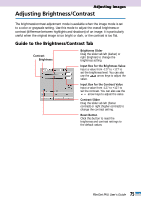
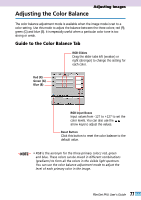
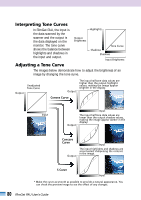
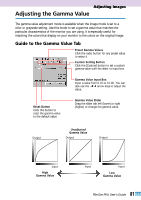
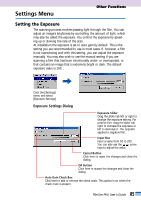
Interpreting Tone Curves In FilmGet FAU, the input is the data scanned by the scanner and the output is the data displayed on the monitor. The tone curve shows the balance between highlights and shadows in the input and output. Highlights Output Brightness Tone Curve Shadows Shadows Input Brightness Adjusting a Tone Curve The images below demonstrate how to adjust the brightness of an image by changing the tone curve. Output Unadjusted Tone Curve Output The input halftone data values are higher than the output highlight values, making the image appear brighter in the display. Convex Curve Input Output Input The input halftone data values are lower than the output shadow values, making the image appear darker in the display. Concave Curve Output Input The input highlights and shadows are accentuated, sharpening the contrast in the image. S Curve Input * Make the curve as smooth as possible to provide a natural appearance. You can check the preview image to see the effect of any changes. 80 FilmGet FAU User's Guide
-
 1
1 -
2
-
3
-
4
-
5
-
6
-
7
-
8
-
9
-
10
-
11
-
12
-
13
-
14
-
15
-
16
-
17
-
18
-
19
-
20
-
21
-
22
-
23
-
24
-
25
-
26
-
27
-
28
-
29
-
30
-
31
-
32
-
33
-
34
-
35
-
36
-
37
-
38
-
39
-
40
-
41
-
42
-
43
-
44
-
45
-
46
-
47
-
48
-
49
-
50
-
51
-
52
-
53
-
54
-
55
-
56
-
57
-
58
-
59
-
60
-
61
-
62
-
63
-
64
-
65
-
66
-
67
-
68
-
69
-
70
-
71
-
72
-
73
-
74
-
 75
75 -
 76
76 -
 77
77 -
 78
78 -
 79
79 -
 80
80 -
 81
81 -
 82
82 -
 83
83 -
 84
84 -
 85
85 -
86
-
87
-
88
-
89
-
90
-
91
-
92
-
93
-
94
-
95
-
96
-
97
-
98
-
99
-
100
-
101
-
102
-
103
-
104
-
105
-
106
-
107
-
108
-
109
-
110
-
111
-
112
 |
 |