HP NetServer AA 4000 HP Netserver AA Solution Administrator's Guide v - Page 207
Endurance Performance Monitor, Operating the Endurance Performance Monitor
 |
View all HP NetServer AA 4000 manuals
Add to My Manuals
Save this manual to your list of manuals |
Page 207 highlights
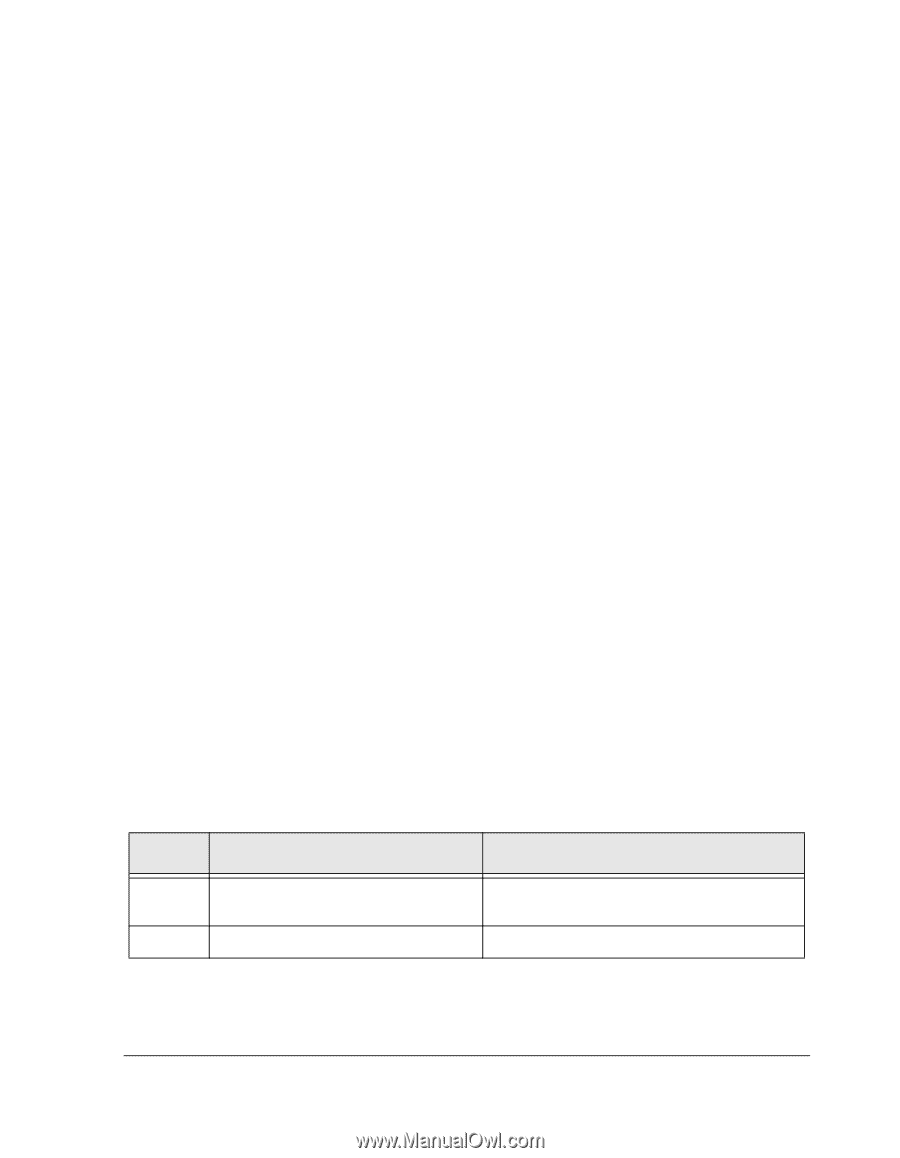
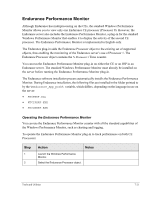
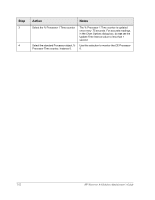
Endurance Performance Monitor Although Endurance has multiprocessing on the CEs, the standard Windows Performance Monitor allows you to view only one Endurance CE processor (Processor 0). However, the Endurance server also includes the Endurance Performance Monitor, a plug-in for the standard Windows Performance Monitor that enables it to display the activity of the second CE processor. The Endurance Performance Monitor is implemented in English only. The Endurance plug-in adds the Endurance Processor object to the existing set of supported objects, thus enabling the monitoring of the Endurance server's use of Processor 1. The Endurance Processor object contains the % Processor 1 Time counter. You can run the Endurance Performance Monitor plug-in on either the CE or an IOP in an Endurance server. The standard Windows Performance Monitor must already be installed on the server before running the Endurance Performance Monitor plug-in. The Endurance software installation process automatically installs the Endurance Performance Monitor. During Endurance installation, the following files are installed in the folder pointed to by the %Endurance_App_path% variable, which differs, depending on the language in use on the server: • MTCPERF.DLL • MTCIPERF.EXE • MTCUPERF.EXE Operating the Endurance Performance Monitor You can use the Endurance Performance Monitor counter with all the standard capabilities of the Windows Performance Monitor, such as charting and logging. To operate the Endurance Performance Monitor plug-in to track performance on both CE Processors: Step 1 2 Action Notes Launch the Windows Performance Monitor. Select the Endurance Processor object. Tools and Utilities 7-21
-
 1
1 -
2
-
3
-
4
-
5
-
6
-
7
-
8
-
9
-
10
-
11
-
12
-
13
-
14
-
15
-
16
-
17
-
18
-
19
-
20
-
21
-
22
-
23
-
24
-
25
-
26
-
27
-
28
-
29
-
30
-
31
-
32
-
33
-
34
-
35
-
36
-
37
-
38
-
39
-
40
-
41
-
42
-
43
-
44
-
45
-
46
-
47
-
48
-
49
-
50
-
51
-
52
-
53
-
54
-
55
-
56
-
57
-
58
-
59
-
60
-
61
-
62
-
63
-
64
-
65
-
66
-
67
-
68
-
69
-
70
-
71
-
72
-
73
-
74
-
75
-
76
-
77
-
78
-
79
-
80
-
81
-
82
-
83
-
84
-
85
-
86
-
87
-
88
-
89
-
90
-
91
-
92
-
93
-
94
-
95
-
96
-
97
-
98
-
99
-
100
-
101
-
102
-
103
-
104
-
105
-
106
-
107
-
108
-
109
-
110
-
111
-
112
-
113
-
114
-
115
-
116
-
117
-
118
-
119
-
120
-
121
-
122
-
123
-
124
-
125
-
126
-
127
-
128
-
129
-
130
-
131
-
132
-
133
-
134
-
135
-
136
-
137
-
138
-
139
-
140
-
141
-
142
-
143
-
144
-
145
-
146
-
147
-
148
-
149
-
150
-
151
-
152
-
153
-
154
-
155
-
156
-
157
-
158
-
159
-
160
-
161
-
162
-
163
-
164
-
165
-
166
-
167
-
168
-
169
-
170
-
171
-
172
-
173
-
174
-
175
-
176
-
177
-
178
-
179
-
180
-
181
-
182
-
183
-
184
-
185
-
186
-
187
-
188
-
189
-
190
-
191
-
192
-
193
-
194
-
195
-
196
-
197
-
198
-
199
-
200
-
201
-
 202
202 -
 203
203 -
 204
204 -
 205
205 -
 206
206 -
 207
207 -
 208
208 -
 209
209 -
 210
210 -
 211
211 -
 212
212 -
213
-
214
-
215
-
216
-
217
-
218
-
219
-
220
-
221
-
222
-
223
-
224
-
225
-
226
-
227
-
228
-
229
-
230
-
231
-
232
-
233
-
234
-
235
-
236
-
237
-
238
-
239
-
240
-
241
-
242
-
243
-
244
-
245
-
246
-
247
-
248
-
249
-
250
-
251
-
252
-
253
-
254
-
255
-
256
-
257
-
258
-
259
-
260
-
261
-
262
-
263
-
264
-
265
-
266
-
267
-
268
-
269
-
270
-
271
-
272
 |
 |