HP Xw460c Administrator's Guide for Microsoft Windows on HP ProLiant Blade Wor - Page 91
Survey tab, Test tab, Type of Test
 |
View all HP Xw460c manuals
Add to My Manuals
Save this manual to your list of manuals |
Page 91 highlights
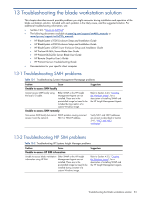
12-7-4 Survey tab The Survey tab displays important system configuration information. In the View section on the left side of the screen, you can select the Summary view to see limited configuration data or select the Advanced view to see all the data in the selected category. The following categories of information are available on the Survey tab: • All-Provides a listing of all categories of information about the computer. • Overview-Provides a listing of general information about the computer. • Architecture-Shows they type of bus the computer uses and BIOS information. In addition, if the bus is a PCI, information about the PCI configuration is displayed. • Asset Control-Shows asset tag, system serial number, and processor information. • Communication-Shows information about the computer parallel port (LPT) and serial port (COM) settings, and USB and network controller information. • Graphics-Shows information about the graphics controller of the computer. • Input Devices-Shows information about the keyboard, mouse, and other input devices connected to the computer. • Memory-Shows information about all memory in the computer. This includes memory slots on the system board and any memory modules installed. • Miscellaneous-Shows information obtained from the computer configuration memory (CMOS), system management BIOS data, system board data, and diagnostics component information. • Storage-Shows information about storage media connected to the computer. This list includes all fixed disks, diskette drives, and optical drives. • System-Shows information about the system board, processor, chassis, and BIOS, plus internal speaker and PCI bus information. 12-7-5 Test tab The Test tab enables you to choose various parts of the system to test. You can also choose the type of test and testing mode. There are three types of tests to choose from: • Quick Test-Provides a predetermined script for which a sample of each hardware component is tested. Quick Test requires no user intervention in either Unattended or Interactive mode. • Complete Test-Provides a predetermined script in which each hardware component is fully tested. You can select Interactive or Unattended tests, which will change the devices tested during the Complete Test. Most tests are available in Interactive mode but require user intervention. • Custom Test-Provides the most flexibility in controlling testing. Custom Test mode enables you to specifically select which devices, tests, and test parameters are run. You can select tests that do not require any user interaction using the Interactive or Unattended test modes. More tests are available in Interactive mode but require user intervention. To begin testing: 1. Click the Test tab. 2. Select Type of Test to perform and select Interactive or Unattended as the test mode. 3. Determine how you want the test to be executed. a. Select Number of Loops and enter the number of loops to perform. b. Select Total Test Times and enter the amount of time in minutes that you want the diagnostic test to run. 4. When choosing to run the test over a specified number of loops, enter the number of loops to perform. If you want to run the diagnostic test for a specified time period, enter the amount of time in minutes. 5. Click Begin Testing in the lower right corner of the display to start the test. While tests are being performed, you can monitor the progress by clicking the Status tab. Any errors that are detected are summarized in the Error Log. Click Save to save the report to a diskette or a USB key drive (if attached). If the diagnostics utility detects an error during a test, you can mouse-over the failed text in the Status tab to display additional information about the type of error and the error code. To view all test failure information, select Error Log. To view the status of all testing that has been performed click the Log tab. Managing the blade workstation 91
-
 1
1 -
2
-
3
-
4
-
5
-
6
-
7
-
8
-
9
-
10
-
11
-
12
-
13
-
14
-
15
-
16
-
17
-
18
-
19
-
20
-
21
-
22
-
23
-
24
-
25
-
26
-
27
-
28
-
29
-
30
-
31
-
32
-
33
-
34
-
35
-
36
-
37
-
38
-
39
-
40
-
41
-
42
-
43
-
44
-
45
-
46
-
47
-
48
-
49
-
50
-
51
-
52
-
53
-
54
-
55
-
56
-
57
-
58
-
59
-
60
-
61
-
62
-
63
-
64
-
65
-
66
-
67
-
68
-
69
-
70
-
71
-
72
-
73
-
74
-
75
-
76
-
77
-
78
-
79
-
80
-
81
-
82
-
83
-
84
-
85
-
 86
86 -
 87
87 -
 88
88 -
 89
89 -
 90
90 -
 91
91 -
 92
92 -
 93
93 -
 94
94 -
 95
95 -
 96
96 -
97
-
98
-
99
-
100
-
101
-
102
-
103
-
104
-
105
 |
 |
