HP Integrity rx2800 HP Integrity iLO 3 Operations Guide - Page 40
system event submenu, Events are listed as follows
 |
View all HP Integrity rx2800 manuals
Add to My Manuals
Save this manual to your list of manuals |
Page 40 highlights
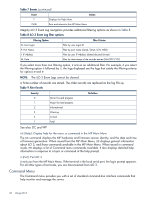
The SL command also displays the contents of the iLO 3 Event Log. The following events are recorded: • iLO 3 MP login and logout attempts • Command logging for specific commands • All entries in the existing history log with more detail Each time a user logs in or out of iLO 3, an event is logged. In the event of a login failure, an event is logged if the number of continuous login failure attempts equals the password fault value. The following example shows the event log viewer menu: Event Log Viewer Menu: Log Name Entries % Full Latest Timestamped Entry E - System Event 51 2 % 27 Mar 2010 02:22:38 F - Forward Progress 1556 7 % I - iLO Event 12 2 % 27 Mar 2010 02:33:26 C - Clear SEL and FPL L - Live Events Enter menu item or [Ctrl-B] to Quit: The following example shows the display in the SL menu E system event submenu: # Location |Alert | Encoded Field | Data Field | Keyword/Timestamp 10 SFW 3,1,0,0 2 5488006341E10011 0000000000000000 BOOT_START 27 Mar 2010 20:07:51 9 SFW 4,0,0,0 2 548C006301E1000F 0000000000000000 BOOT_START 27 Mar 2010 20:07:51 SL:hpiLO (+,-,t SL:hpiLO (+,-,j Jump to entry number: 10 Log Entry 10: 27 Mar 2010 20:07:51 Alert Level 2: Informational Keyword: BOOT_START CPU starting boot Logged by: System Firmware located in bay 3,socket 1,cpu 0,thread 0 Data: Major change in system state - Boot Start 5488006341E10011 0000000000000000 In this example: the "Alert" has a "*" because all alerts >= 3 have a "*". # Location |Alert | Encoded Field | Data Field | Keyword/Timestamp 69 ILO 3 *3 608022E620E10086 0000000000000000 ILO_SPECIAL_MODE 01 Jan 2001 12:32:51 • "#" is the entry number. Use this with the "j" menu comment to a particular log (if you don't want to scroll to it). • Location: 3,1,0,0 means blade 3, socket 1, cpu 0, thread 0. • To find out more about these events, use T to switch to text mode. Command logging is run for the following commands: CA, DC, DI, DNS, FW, ID, IT, LC, LDAP, LM, PC, PM, PR, RS, SA, SO, TC, UC, WOL Events are listed as follows: 40 Using iLO 3
-
 1
1 -
2
-
3
-
4
-
5
-
6
-
7
-
8
-
9
-
10
-
11
-
12
-
13
-
14
-
15
-
16
-
17
-
18
-
19
-
20
-
21
-
22
-
23
-
24
-
25
-
26
-
27
-
28
-
29
-
30
-
31
-
32
-
33
-
34
-
 35
35 -
 36
36 -
 37
37 -
 38
38 -
 39
39 -
 40
40 -
 41
41 -
 42
42 -
 43
43 -
 44
44 -
 45
45 -
46
-
47
-
48
-
49
-
50
-
51
-
52
-
53
-
54
-
55
-
56
-
57
-
58
-
59
-
60
-
61
-
62
-
63
-
64
-
65
-
66
-
67
-
68
-
69
-
70
-
71
-
72
-
73
-
74
-
75
-
76
-
77
-
78
-
79
-
80
-
81
-
82
-
83
-
84
-
85
-
86
-
87
-
88
-
89
-
90
-
91
-
92
-
93
-
94
-
95
-
96
-
97
-
98
-
99
-
100
-
101
-
102
-
103
-
104
-
105
-
106
-
107
-
108
-
109
-
110
-
111
-
112
-
113
-
114
-
115
-
116
-
117
-
118
-
119
-
120
-
121
-
122
-
123
-
124
-
125
-
126
-
127
-
128
-
129
-
130
-
131
-
132
-
133
-
134
-
135
-
136
-
137
-
138
-
139
-
140
-
141
-
142
-
143
-
144
-
145
-
146
-
147
-
148
-
149
-
150
-
151
-
152
 |
 |
