Pioneer AVIC-D3 Owner's Manual - Page 61
When checking traffic conges, tion information manually, Traffic flow information - navigation manual
 |
UPC - 012562844169
View all Pioneer AVIC-D3 manuals
Add to My Manuals
Save this manual to your list of manuals |
Page 61 highlights
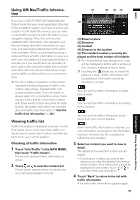
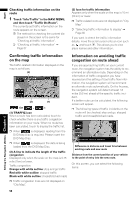
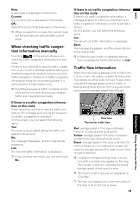
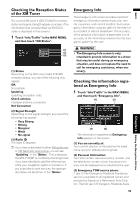
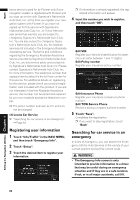
New: A new route is displayed on the screen. Current: The current route is displayed on the screen. OK: Select the route to that displayed on the screen. ❒ When no selection is made, the current route will be automatically selected after a short while. When checking traffic congestion information manually Touching on the screen allows you to check for traffic congestion information on your route. If there is any information about a traffic conges- tion on your route, a message appears asking you whether to search for another route to avoid the traffic congestion. If there is no traffic congestion information along the route being guided, it is announced on screen and by voice. ❒ The following types of traffic incidents on the route will be checked: stop and go, stopped traffic and closed/blocked roads. If there is a traffic congestion information on the route When receiving information about a traffic congestion, the message announcing the presence of a traffic congestion is indicated. On this screen, you can select the following items: Yes: The route is recalculated taking the traffic congestion into account. No: The message disappears, and the map display reappears. List: The list with traffic information is displayed. ❒ In the memory navi mode, you can only touch No. If there is no traffic congestion information on the route If there is no traffic congestion information, a message appears to inform you that there is no traffic congestion information on the route that is shown. On this screen, you can select the following items: List: The list with all traffic information is displayed. Back: The message disappears, and the screen returns to the map screen. ❒ In Memory Navi mode, no detailed informa- tion is available for traffic information on List. Traffic flow information When the map scale is between 0.02 mi (25 m) to 0.75 mi (1 km), red, yellow, or green blinking lines may appear on either side of a road. These colors indicate the average speed at which traffic is flowing along these streets. Here is a guide to the colors and the average speed they indicate: Flow Icon The line for traffic flow Red: average speed in this area is between 5 mph to 15 mph (8 km/h to 24 km/h) Yellow: average speed in this area is between 20 mph to 40 mph (32 km/h to 64 km/h) Green: average speed in this area is 45 mph (72 km/h) or faster (An icon without a number indicates the average speed of the road is more than 70 mph (112km/h)) ❒ In addition to these blinking lines, a round icon with a number may appear on the map. The number in the icon indicates the actual average speed of that specific area. ❒ The lines for traffic flow are not displayed on "City Map". ❒ The flow icon appears only when the scale on the map is 10 mi (20 km) or lower. 59 Chapter 4 Editing the Navigation Utilities NAVI
-
 1
1 -
2
-
3
-
4
-
5
-
6
-
7
-
8
-
9
-
10
-
11
-
12
-
13
-
14
-
15
-
16
-
17
-
18
-
19
-
20
-
21
-
22
-
23
-
24
-
25
-
26
-
27
-
28
-
29
-
30
-
31
-
32
-
33
-
34
-
35
-
36
-
37
-
38
-
39
-
40
-
41
-
42
-
43
-
44
-
45
-
46
-
47
-
48
-
49
-
50
-
51
-
52
-
53
-
54
-
55
-
 56
56 -
 57
57 -
 58
58 -
 59
59 -
 60
60 -
 61
61 -
 62
62 -
 63
63 -
 64
64 -
 65
65 -
 66
66 -
67
-
68
-
69
-
70
-
71
-
72
-
73
-
74
-
75
-
76
-
77
-
78
-
79
-
80
-
81
-
82
-
83
-
84
-
85
-
86
-
87
-
88
-
89
-
90
-
91
-
92
-
93
-
94
-
95
-
96
-
97
-
98
-
99
-
100
-
101
-
102
-
103
-
104
-
105
-
106
-
107
-
108
-
109
-
110
-
111
-
112
-
113
-
114
-
115
-
116
-
117
-
118
-
119
-
120
-
121
-
122
-
123
-
124
-
125
-
126
-
127
-
128
-
129
-
130
-
131
-
132
-
133
-
134
-
135
-
136
-
137
-
138
-
139
-
140
-
141
-
142
-
143
-
144
-
145
-
146
-
147
-
148
-
149
-
150
-
151
-
152
-
153
-
154
-
155
-
156
-
157
-
158
-
159
-
160
-
161
-
162
-
163
-
164
-
165
-
166
-
167
-
168
-
169
-
170
-
171
-
172
-
173
 |
 |
