Lexmark X925 Lexmark Document Distributor - Page 81
Using built-in reports, Report by Time
 |
View all Lexmark X925 manuals
Add to My Manuals
Save this manual to your list of manuals |
Page 81 highlights
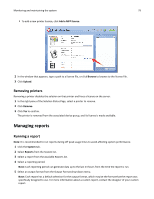
Monitoring and maintaining the system 81 c Select an output format from the Output Format drop‑down menu. Note: Each report has a default selection for Output Format, which may be the format that the report was specifically designed to use. For more information about a custom report, contact the designer of your custom report. d Save the report to a file or send it in an e‑mail message: To save the report to a file: 1 Select the Save To check box. 2 Click beside the Save To field. 3 Type a destination folder path using either a local drive letter or a UNC path for a network share. 4 If the folder is located on a network share that requires authentication, then type the network share user name and password. 5 Click OK. To send the report in an e‑mail message: 1 Select the Save To check box.. 2 Click beside the Email To field. e If additional query parameters are available for the selected report, then click Additional Parameters to specify values for those parameters. If no additional parameters are available, then the button is disabled. 6 Click Next. 7 Enter a start date and a start time. 8 Configure the frequency of the scheduled event, and then click Finish. Using built‑in reports Built‑in reports are available to display commonly used data. All built‑in reports are designed for PDF output, except for those that specify CSV in the report title. • Jobs Report ‑ CSV-This displays the jobs list in CSV format. • Log Report ‑ CSV-This displays all log entries in CSV format. • Log Report ‑ Failed Jobs-This displays log entries for failed jobs. • Printer Report-This displays data related to printer usage, such as printer success rates, printer model usage, printer usage per profile, and most active users per printer. • Report by Time-This displays daily and hourly data, such as job totals, job success rates, printer usage, user usage, server usage, and job durations. • Server Report-This displays data related to server usage, such as job success rates, hourly job rates, job duration, and server distribution. Both a summary for all servers and details for individual servers are available. • Software Client Report-This displays data related to software client usage, such as software client success rates, software client usage per profile, and most active users per software client. • Solution Report-This displays data related to solution usage, such as solution success rates, most used solutions, and how solutions are accessed. • Task Summary Report-This displays data related to tasks, such as task attempts, task success rates, and task times. Both a summary and details are available. • Tops Report-This displays the most active of the following elements: - Users - Printers
-
 1
1 -
2
-
3
-
4
-
5
-
6
-
7
-
8
-
9
-
10
-
11
-
12
-
13
-
14
-
15
-
16
-
17
-
18
-
19
-
20
-
21
-
22
-
23
-
24
-
25
-
26
-
27
-
28
-
29
-
30
-
31
-
32
-
33
-
34
-
35
-
36
-
37
-
38
-
39
-
40
-
41
-
42
-
43
-
44
-
45
-
46
-
47
-
48
-
49
-
50
-
51
-
52
-
53
-
54
-
55
-
56
-
57
-
58
-
59
-
60
-
61
-
62
-
63
-
64
-
65
-
66
-
67
-
68
-
69
-
70
-
71
-
72
-
73
-
74
-
75
-
 76
76 -
 77
77 -
 78
78 -
 79
79 -
 80
80 -
 81
81 -
 82
82 -
 83
83 -
 84
84 -
 85
85 -
 86
86 -
87
-
88
-
89
-
90
-
91
-
92
-
93
-
94
-
95
-
96
-
97
-
98
-
99
-
100
-
101
-
102
-
103
-
104
-
105
-
106
-
107
-
108
-
109
-
110
-
111
-
112
-
113
-
114
-
115
-
116
-
117
-
118
-
119
-
120
-
121
-
122
-
123
-
124
-
125
-
126
-
127
-
128
-
129
-
130
-
131
-
132
-
133
-
134
-
135
-
136
-
137
-
138
-
139
-
140
-
141
-
142
-
143
-
144
-
145
-
146
 |
 |