Netgear WC7520 WC7520 Reference Manual - Page 112
Logs and Alerts, Load Balancing
 |
UPC - 606449072969
View all Netgear WC7520 manuals
Add to My Manuals
Save this manual to your list of manuals |
Page 112 highlights
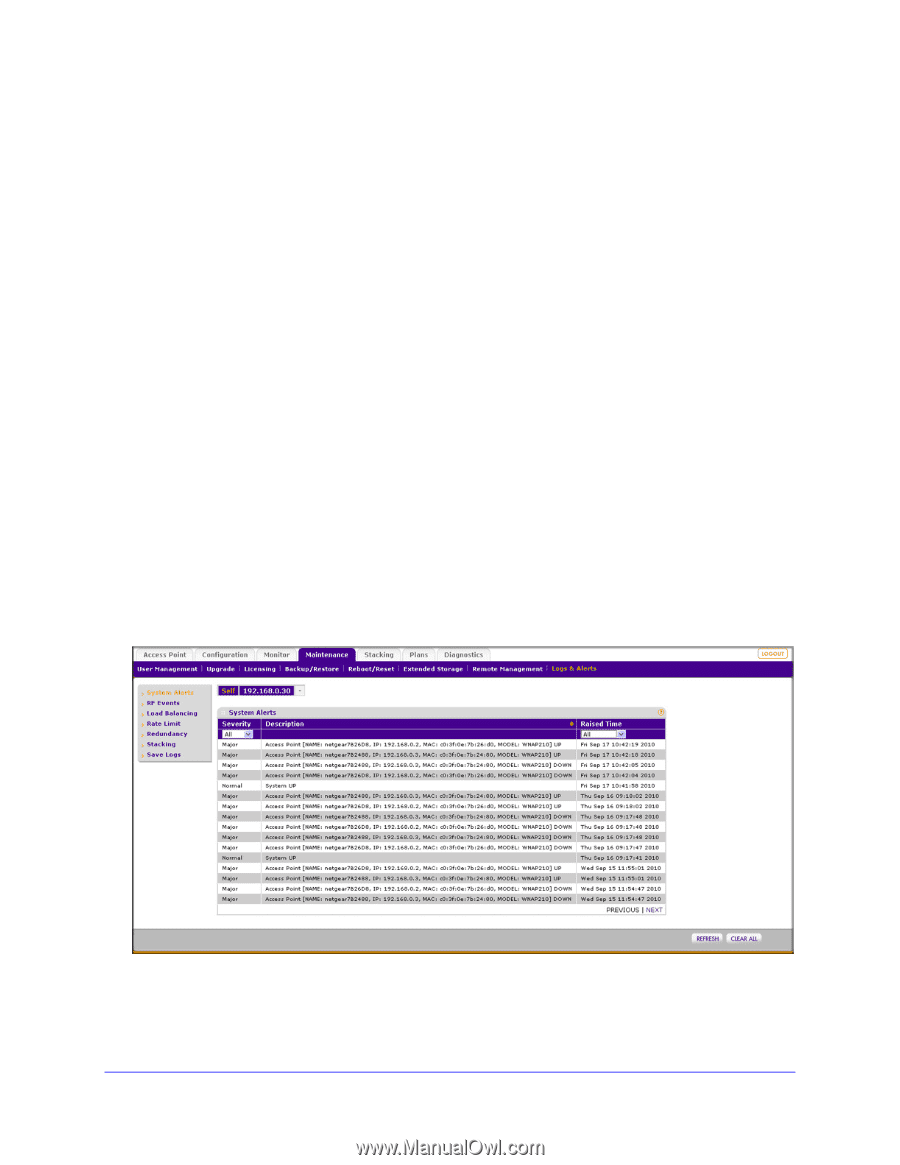
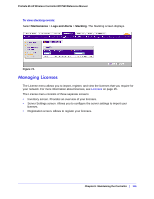
ProSafe 20-AP Wireless Controller WC7520 Reference Manual • RF Events. Radio frequency events such as detected coverage holes. • Load Balancing. Load balancing events such as a bad RSSI for a client. • Rate Limit. Rate limit events. • Redundancy. Redundancy events such as the redundant wireless controller coming up or going down, and failover events. • Stacking. Stacking events such as secondary wireless controllers (slaves) coming up or going down, and synchronization events. Each screen that display alerts or events contain a table with with three columns: • Severity. The alarm severity level: All, Minor, Normal, Major, or Critical. You can sort each table on severity level by using the Severity drop-down list. • Description. The description of the alert or event, which is self-explanatory. • Raised Time. The date and time that the alert or event was raised. You can sort each table on the time that the alert or event was raised by using the Raised Time drop-down list. To view additional alerts or events, click Next; to return to the previous alerts or events, click Previous. To display the latest information on screen click the Refresh button. To clear all information from the screen and from memory, click the Clear All button. To view system alerts: Select Maintenance > Logs and Alerts > System Alerts. The System Alerts screen displays. Figure 69. To clear the existing log, click Clear All. Consider saving the contents before you clear the system alerts (see Saving Logs on page 111). Chapter 9: Maintaining the Controller | 112
-
 1
1 -
2
-
3
-
4
-
5
-
6
-
7
-
8
-
9
-
10
-
11
-
12
-
13
-
14
-
15
-
16
-
17
-
18
-
19
-
20
-
21
-
22
-
23
-
24
-
25
-
26
-
27
-
28
-
29
-
30
-
31
-
32
-
33
-
34
-
35
-
36
-
37
-
38
-
39
-
40
-
41
-
42
-
43
-
44
-
45
-
46
-
47
-
48
-
49
-
50
-
51
-
52
-
53
-
54
-
55
-
56
-
57
-
58
-
59
-
60
-
61
-
62
-
63
-
64
-
65
-
66
-
67
-
68
-
69
-
70
-
71
-
72
-
73
-
74
-
75
-
76
-
77
-
78
-
79
-
80
-
81
-
82
-
83
-
84
-
85
-
86
-
87
-
88
-
89
-
90
-
91
-
92
-
93
-
94
-
95
-
96
-
97
-
98
-
99
-
100
-
101
-
102
-
103
-
104
-
105
-
106
-
 107
107 -
 108
108 -
 109
109 -
 110
110 -
 111
111 -
 112
112 -
 113
113 -
 114
114 -
 115
115 -
 116
116 -
 117
117 -
118
-
119
-
120
-
121
-
122
-
123
-
124
-
125
-
126
-
127
-
128
-
129
-
130
-
131
-
132
-
133
-
134
-
135
-
136
-
137
-
138
-
139
-
140
-
141
-
142
-
143
-
144
-
145
-
146
-
147
-
148
-
149
-
150
-
151
-
152
-
153
-
154
-
155
-
156
-
157
-
158
-
159
-
160
-
161
-
162
 |
 |