Netgear WC7520 WC7520 Reference Manual - Page 42
Viewing and Managing Heat Maps for Deployed Plans
 |
UPC - 606449072969
View all Netgear WC7520 manuals
Add to My Manuals
Save this manual to your list of manuals |
Page 42 highlights
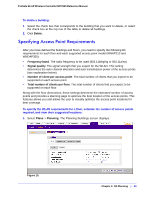
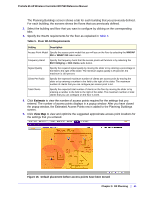
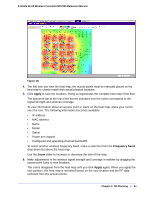
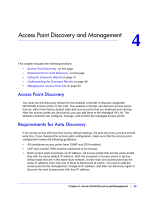
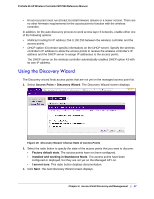
ProSafe 20-AP Wireless Controller WC7520 Reference Manual Note that the planning tool only provides default placement and shows the coverage area for each access point. 6. Move the access points to optimize coverage in desired areas and avoid coverage in unwanted areas based on the floor plan. Colored circles around the access point symbols indicate the expected approximate coverage of the individual access point, and the color of the circle represents the expected quality of the signal strength: a darker color indicates signal overlap with nearby access points. Note: A red color indicates the strongest coverage area: better than -50 dBm RSSI; an orange color better than -60 dBm; a yellow color better than -70 dBm; and so on. Moderate overlap is required for seamless roaming. No overlap will lead to disconnections and dead spots You can click an access point icon and drag it to manually reposition it to see how the new location would affect the coverage. Click Cancel to undo any access point repositioning changes. Use the Zoom slider to increase or decrease the size of the map. 7. Click Save to save the location map, or click Back to return to the Planning Buildings screen without savings changes to the location map. Note: For each floor, you can save one location map only. When you modify and save the location map, the previously saved location map is overwritten. Viewing and Managing Heat Maps for Deployed Plans A heat map lets you view in realtime, by wireless frequency band, the signal strength and wireless coverage for a building floor. The heat map shows the actual signal strengths that each access point is detecting from neighbor access points. Note: For the heat maps to work correctly, the access point placement on the floor plan must closely match the actual physical location of the access points. The heat map shows the following information • Signal strength and wireless coverage, including coverage holes. • Known access points that are managed by the wireless controller Chapter 3: RF Planning | 42
-
 1
1 -
2
-
3
-
4
-
5
-
6
-
7
-
8
-
9
-
10
-
11
-
12
-
13
-
14
-
15
-
16
-
17
-
18
-
19
-
20
-
21
-
22
-
23
-
24
-
25
-
26
-
27
-
28
-
29
-
30
-
31
-
32
-
33
-
34
-
35
-
36
-
 37
37 -
 38
38 -
 39
39 -
 40
40 -
 41
41 -
 42
42 -
 43
43 -
 44
44 -
 45
45 -
 46
46 -
 47
47 -
48
-
49
-
50
-
51
-
52
-
53
-
54
-
55
-
56
-
57
-
58
-
59
-
60
-
61
-
62
-
63
-
64
-
65
-
66
-
67
-
68
-
69
-
70
-
71
-
72
-
73
-
74
-
75
-
76
-
77
-
78
-
79
-
80
-
81
-
82
-
83
-
84
-
85
-
86
-
87
-
88
-
89
-
90
-
91
-
92
-
93
-
94
-
95
-
96
-
97
-
98
-
99
-
100
-
101
-
102
-
103
-
104
-
105
-
106
-
107
-
108
-
109
-
110
-
111
-
112
-
113
-
114
-
115
-
116
-
117
-
118
-
119
-
120
-
121
-
122
-
123
-
124
-
125
-
126
-
127
-
128
-
129
-
130
-
131
-
132
-
133
-
134
-
135
-
136
-
137
-
138
-
139
-
140
-
141
-
142
-
143
-
144
-
145
-
146
-
147
-
148
-
149
-
150
-
151
-
152
-
153
-
154
-
155
-
156
-
157
-
158
-
159
-
160
-
161
-
162
 |
 |
