Cisco SR224T Administration Guide - Page 25
Warning, Administration, System Log, Log Settings, Logging, Syslog Aggregator, Max Aggregation Time
 |
View all Cisco SR224T manuals
Add to My Manuals
Save this manual to your list of manuals |
Page 25 highlights
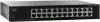
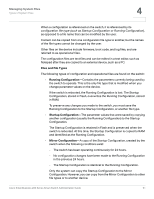
Managing System Logs Setting System Log Settings 3 The event severity levels are listed from the highest severity to the lowest severity, as follows: • Emergency-System is not usable. • Alert-Action is needed. • Critical-System is in a critical condition. • Error-System is in error condition. • Warning-System warning has occurred. • Notice-System is functioning properly, but a system notice has occurred. • Informational-Device information. • Debug-Detailed information about an event. You can select different severity levels for RAM and Flash logs. These logs are displayed in the RAM Memory page and Flash Memory page, respectively. Selecting a severity level to be stored in a log causes all of the higher severity events to be automatically stored in the log. Lower severity events are not stored in the log. For example, if Warning is selected, all severity levels that are Warning and higher are stored in the log (Emergency, Alert, Critical, Error, and Warning). No events with severity level below Warning are stored (Notice, Informational, and Debug). To set global log parameters: STEP 1 Click Administration > System Log > Log Settings. The Log Settings page opens. STEP 2 Enter the parameters. • Logging-Select to enable message logging. • Syslog Aggregator-Select to enable the aggregation of SYSLOG messages and traps. If enabled, identical and contiguous SYSLOG messages and traps are aggregated over the specified Max Aggregation Time and sent in a single message. The aggregated messages are sent in the order of their arrival. Each message states the number of times it was aggregated. • Max Aggregation Time-Enter the interval of time that SYSLOG messages are aggregated. Cisco Small Business 200 Series Smart Switch Administration Guide 26
-
 1
1 -
2
-
3
-
4
-
5
-
6
-
7
-
8
-
9
-
10
-
11
-
12
-
13
-
14
-
15
-
16
-
17
-
18
-
19
-
 20
20 -
 21
21 -
 22
22 -
 23
23 -
 24
24 -
 25
25 -
 26
26 -
 27
27 -
 28
28 -
 29
29 -
 30
30 -
31
-
32
-
33
-
34
-
35
-
36
-
37
-
38
-
39
-
40
-
41
-
42
-
43
-
44
-
45
-
46
-
47
-
48
-
49
-
50
-
51
-
52
-
53
-
54
-
55
-
56
-
57
-
58
-
59
-
60
-
61
-
62
-
63
-
64
-
65
-
66
-
67
-
68
-
69
-
70
-
71
-
72
-
73
-
74
-
75
-
76
-
77
-
78
-
79
-
80
-
81
-
82
-
83
-
84
-
85
-
86
-
87
-
88
-
89
-
90
-
91
-
92
-
93
-
94
-
95
-
96
-
97
-
98
-
99
-
100
-
101
-
102
-
103
-
104
-
105
-
106
-
107
-
108
-
109
-
110
-
111
-
112
-
113
-
114
-
115
-
116
-
117
-
118
-
119
-
120
-
121
-
122
-
123
-
124
-
125
-
126
-
127
-
128
-
129
-
130
-
131
-
132
-
133
-
134
-
135
-
136
-
137
-
138
-
139
-
140
-
141
-
142
-
143
-
144
-
145
-
146
-
147
-
148
-
149
-
150
-
151
-
152
-
153
-
154
-
155
-
156
-
157
-
158
-
159
-
160
-
161
-
162
-
163
-
164
-
165
-
166
-
167
-
168
-
169
-
170
-
171
-
172
-
173
-
174
-
175
-
176
-
177
-
178
-
179
-
180
-
181
-
182
-
183
-
184
-
185
-
186
-
187
-
188
-
189
-
190
-
191
-
192
-
193
-
194
-
195
-
196
-
197
-
198
-
199
-
200
-
201
-
202
-
203
-
204
-
205
-
206
-
207
-
208
-
209
-
210
-
211
-
212
-
213
-
214
-
215
-
216
-
217
-
218
-
219
-
220
-
221
-
222
-
223
-
224
-
225
-
226
-
227
-
228
-
229
-
230
-
231
-
232
-
233
-
234
-
235
-
236
-
237
-
238
-
239
-
240
-
241
-
242
-
243
-
244
-
245
-
246
-
247
-
248
-
249
-
250
-
251
-
252
-
253
-
254
-
255
-
256
-
257
-
258
-
259
-
260
-
261
-
262
-
263
-
264
-
265
-
266
-
267
-
268
-
269
-
270
-
271
-
272
-
273
-
274
-
275
-
276
-
277
-
278
-
279
-
280
-
281
-
282
-
283
 |
 |
