Dell PowerConnect Brocade M6505 Brocade 7.1.0 Web Tools Administrator's Guide - Page 117
Monitoring Performance, In this Performance Monitor overview, Basic monitoring
 |
View all Dell PowerConnect Brocade M6505 manuals
Add to My Manuals
Save this manual to your list of manuals |
Page 117 highlights
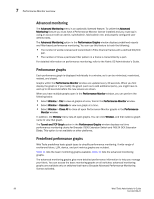
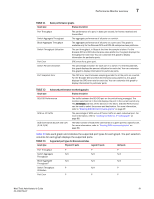
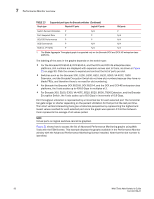
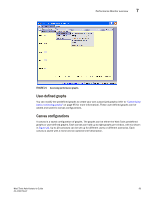
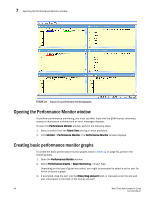
Monitoring Performance Chapter 7 In this chapter •Performance Monitor overview 89 •Opening the Performance Monitor window 94 •Creating basic performance monitor graphs 94 •Customizing basic monitoring graphs 95 •Advanced performance monitoring graphs 97 •Tunnel and TCP performance monitoring graphs 99 •Saving graphs to a canvas 100 •Adding graphs to an existing canvas 101 •Printing graphs 101 •Modifying graphs 101 Performance Monitor overview The Web Tools Performance Monitoring tool graphically displays throughput (in megabytes per second) for each port and for the entire switch. To utilize performance monitoring, the EGM license must be enabled on the switch. Otherwise, when you select Monitor > Performance Monitor, access to this feature is denied and an error messages displays Basic monitoring The Basic Monitoring menu is standard in the Web Tools software. Any user logged into Web Tools with an associated role of zoneadmin or securityadmin cannot open Performance Monitor. The roles user, operator, basicswitchadmin, and properly configured user defined roles are allowed to perform basic monitoring tasks. Only users with the admin, switchadmin and fabricadmin roles associated with their login accounts are able to save or display a canvas. Use the Basic Monitoring option in the Performance Graphs window to do the following: • Create user-definable reports. • Display a performance canvas for application-level or fabric-level views. • Save persistent graphs across restarts (saves parameter data across restarts). Web Tools Administrator's Guide 89 53-1002756-01
-
 1
1 -
2
-
3
-
4
-
5
-
6
-
7
-
8
-
9
-
10
-
11
-
12
-
13
-
14
-
15
-
16
-
17
-
18
-
19
-
20
-
21
-
22
-
23
-
24
-
25
-
26
-
27
-
28
-
29
-
30
-
31
-
32
-
33
-
34
-
35
-
36
-
37
-
38
-
39
-
40
-
41
-
42
-
43
-
44
-
45
-
46
-
47
-
48
-
49
-
50
-
51
-
52
-
53
-
54
-
55
-
56
-
57
-
58
-
59
-
60
-
61
-
62
-
63
-
64
-
65
-
66
-
67
-
68
-
69
-
70
-
71
-
72
-
73
-
74
-
75
-
76
-
77
-
78
-
79
-
80
-
81
-
82
-
83
-
84
-
85
-
86
-
87
-
88
-
89
-
90
-
91
-
92
-
93
-
94
-
95
-
96
-
97
-
98
-
99
-
100
-
101
-
102
-
103
-
104
-
105
-
106
-
107
-
108
-
109
-
110
-
111
-
 112
112 -
 113
113 -
 114
114 -
 115
115 -
 116
116 -
 117
117 -
 118
118 -
 119
119 -
 120
120 -
 121
121 -
 122
122 -
123
-
124
-
125
-
126
-
127
-
128
-
129
-
130
-
131
-
132
-
133
-
134
-
135
-
136
-
137
-
138
-
139
-
140
-
141
-
142
-
143
-
144
-
145
-
146
-
147
-
148
-
149
-
150
-
151
-
152
-
153
-
154
-
155
-
156
-
157
-
158
-
159
-
160
-
161
-
162
-
163
-
164
-
165
-
166
-
167
-
168
-
169
-
170
-
171
-
172
-
173
-
174
-
175
-
176
-
177
-
178
-
179
-
180
-
181
-
182
-
183
-
184
-
185
-
186
-
187
-
188
-
189
-
190
-
191
-
192
-
193
-
194
-
195
-
196
-
197
-
198
-
199
-
200
-
201
-
202
-
203
-
204
-
205
-
206
-
207
-
208
-
209
-
210
-
211
-
212
-
213
-
214
-
215
-
216
-
217
-
218
-
219
-
220
-
221
-
222
-
223
-
224
-
225
-
226
-
227
-
228
-
229
-
230
-
231
-
232
-
233
-
234
-
235
-
236
-
237
-
238
-
239
-
240
-
241
-
242
-
243
-
244
-
245
-
246
-
247
-
248
-
249
-
250
-
251
-
252
-
253
-
254
-
255
-
256
-
257
-
258
-
259
-
260
-
261
-
262
-
263
-
264
-
265
-
266
-
267
-
268
 |
 |