Dell PowerConnect Brocade M6505 Brocade 7.1.0 Web Tools Administrator's Guide - Page 128
Tunnel and TCP graph chart properties, Saving graphs to a canvas
 |
View all Dell PowerConnect Brocade M6505 manuals
Add to My Manuals
Save this manual to your list of manuals |
Page 128 highlights
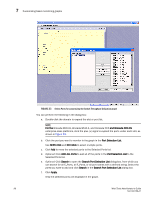
7 Saving graphs to a canvas 4. In the Tunnel and TCP area at the bottom of the screen, select the required check boxes for the statistic you want to graph. Note that each column represents a different graph. 5. Click Options to set the display options for the graphs. • Range: The range is from 3 through 30 seconds. The X axis is limited to 30 minutes. The graph scale starts with 0 minutes and auto scales to draw the statistics. Once the 30 minutes graph is drawn, the first minute data is removed to accommodate the 31st minute values. • Global auto scaling: By default, this option is in disabled mode. User can either enable or disable this option. If enabled, the graph's X-axis scale up to 30 minutes and if it is disabled, the X-axis will scale up to 10 minutes • Number of graphs per row: Designate how many graphs you wish to appear in each row. 6. Click Generate. 7. Click Reset to reset all the graphs. NOTE Brocade Network Advisor has an option for launching the TCP circuit Performance statistics dialog . Tunnel and TCP graph chart properties When a Tunnel and TCP graph displays, you can right-click the graph to access the display properties. These properties include: • Font selection • Background color selection • Title text • Display zoom These value selections are not persistent. When you close the graph, these values reset to the default settings. In addition, you can print the graph and save the graph to a file Saving graphs to a canvas Saving graphs is useful when you create customized graphs and do not want to recreate them each time you access the Performance Monitor window. When you save graphs, you must save them to a canvas. The following procedure describes how to save graphs to a new canvas. 1. Open the Performance Monitor window. 2. Create basic or advanced Performance Monitor graphs, as described in "Creating basic performance monitor graphs" on page 94 and "Advanced performance monitoring graphs" on page 97. The graphs display in the Performance Monitor window. 100 Web Tools Administrator's Guide 53-1002756-01
-
 1
1 -
2
-
3
-
4
-
5
-
6
-
7
-
8
-
9
-
10
-
11
-
12
-
13
-
14
-
15
-
16
-
17
-
18
-
19
-
20
-
21
-
22
-
23
-
24
-
25
-
26
-
27
-
28
-
29
-
30
-
31
-
32
-
33
-
34
-
35
-
36
-
37
-
38
-
39
-
40
-
41
-
42
-
43
-
44
-
45
-
46
-
47
-
48
-
49
-
50
-
51
-
52
-
53
-
54
-
55
-
56
-
57
-
58
-
59
-
60
-
61
-
62
-
63
-
64
-
65
-
66
-
67
-
68
-
69
-
70
-
71
-
72
-
73
-
74
-
75
-
76
-
77
-
78
-
79
-
80
-
81
-
82
-
83
-
84
-
85
-
86
-
87
-
88
-
89
-
90
-
91
-
92
-
93
-
94
-
95
-
96
-
97
-
98
-
99
-
100
-
101
-
102
-
103
-
104
-
105
-
106
-
107
-
108
-
109
-
110
-
111
-
112
-
113
-
114
-
115
-
116
-
117
-
118
-
119
-
120
-
121
-
122
-
 123
123 -
 124
124 -
 125
125 -
 126
126 -
 127
127 -
 128
128 -
 129
129 -
 130
130 -
 131
131 -
 132
132 -
 133
133 -
134
-
135
-
136
-
137
-
138
-
139
-
140
-
141
-
142
-
143
-
144
-
145
-
146
-
147
-
148
-
149
-
150
-
151
-
152
-
153
-
154
-
155
-
156
-
157
-
158
-
159
-
160
-
161
-
162
-
163
-
164
-
165
-
166
-
167
-
168
-
169
-
170
-
171
-
172
-
173
-
174
-
175
-
176
-
177
-
178
-
179
-
180
-
181
-
182
-
183
-
184
-
185
-
186
-
187
-
188
-
189
-
190
-
191
-
192
-
193
-
194
-
195
-
196
-
197
-
198
-
199
-
200
-
201
-
202
-
203
-
204
-
205
-
206
-
207
-
208
-
209
-
210
-
211
-
212
-
213
-
214
-
215
-
216
-
217
-
218
-
219
-
220
-
221
-
222
-
223
-
224
-
225
-
226
-
227
-
228
-
229
-
230
-
231
-
232
-
233
-
234
-
235
-
236
-
237
-
238
-
239
-
240
-
241
-
242
-
243
-
244
-
245
-
246
-
247
-
248
-
249
-
250
-
251
-
252
-
253
-
254
-
255
-
256
-
257
-
258
-
259
-
260
-
261
-
262
-
263
-
264
-
265
-
266
-
267
-
268
 |
 |