Dell PowerConnect Brocade M6505 Brocade 7.1.0 Web Tools Administrator's Guide - Page 9

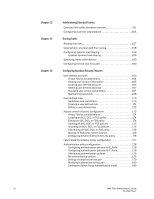
Monitoring Performance, Administering Zoning, Creating the SCSI vs. IP Traffic graph ..98

Page 9 highlights

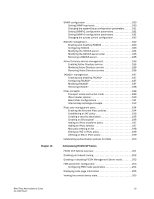
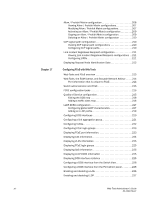
Chapter 7 Chapter 8 F_Port trunk groups 87 Creating and maintaining F_Port trunk groups 87 Monitoring Performance Performance Monitor overview 89 Basic monitoring 89 Advanced monitoring 90 Performance graphs 90 Predefined performance graphs 90 User-defined graphs 93 Canvas configurations 93 Opening the Performance Monitor window 94 Creating basic performance monitor graphs 94 Customizing basic monitoring graphs 95 Advanced performance monitoring graphs 97 Creating SID-DID Performance graphs 97 Creating the SCSI vs. IP Traffic graph 98 Creating SCSI command graphs 98 Tunnel and TCP performance monitoring graphs 99 Tunnel and TCP graph chart properties 100 Saving graphs to a canvas 100 Adding graphs to an existing canvas 101 Printing graphs 101 Modifying graphs 101 Administering Zoning Zoning overview 103 Basic zones 103 Traffic Isolation zones 103 LSAN zone requirements 104 QoS zone requirements 104 Zoning configurations 104 Opening the Zone Admin window 104 Setting the default zoning mode 105 Web Tools Administrator's Guide ix 53-1002756-01

  • 1
  • 2
  • 3
  • 4
  • 5
  • 6
  • 7
  • 8
  • 9
  • 10
  • 11
  • 12
  • 13
  • 14
  • 15
  • 16
  • 17
  • 18
  • 19
  • 20
  • 21
  • 22
  • 23
  • 24
  • 25
  • 26
  • 27
  • 28
  • 29
  • 30
  • 31
  • 32
  • 33
  • 34
  • 35
  • 36
  • 37
  • 38
  • 39
  • 40
  • 41
  • 42
  • 43
  • 44
  • 45
  • 46
  • 47
  • 48
  • 49
  • 50
  • 51
  • 52
  • 53
  • 54
  • 55
  • 56
  • 57
  • 58
  • 59
  • 60
  • 61
  • 62
  • 63
  • 64
  • 65
  • 66
  • 67
  • 68
  • 69
  • 70
  • 71
  • 72
  • 73
  • 74
  • 75
  • 76
  • 77
  • 78
  • 79
  • 80
  • 81
  • 82
  • 83
  • 84
  • 85
  • 86
  • 87
  • 88
  • 89
  • 90
  • 91
  • 92
  • 93
  • 94
  • 95
  • 96
  • 97
  • 98
  • 99
  • 100
  • 101
  • 102
  • 103
  • 104
  • 105
  • 106
  • 107
  • 108
  • 109
  • 110
  • 111
  • 112
  • 113
  • 114
  • 115
  • 116
  • 117
  • 118
  • 119
  • 120
  • 121
  • 122
  • 123
  • 124
  • 125
  • 126
  • 127
  • 128
  • 129
  • 130
  • 131
  • 132
  • 133
  • 134
  • 135
  • 136
  • 137
  • 138
  • 139
  • 140
  • 141
  • 142
  • 143
  • 144
  • 145
  • 146
  • 147
  • 148
  • 149
  • 150
  • 151
  • 152
  • 153
  • 154
  • 155
  • 156
  • 157
  • 158
  • 159
  • 160
  • 161
  • 162
  • 163
  • 164
  • 165
  • 166
  • 167
  • 168
  • 169
  • 170
  • 171
  • 172
  • 173
  • 174
  • 175
  • 176
  • 177
  • 178
  • 179
  • 180
  • 181
  • 182
  • 183
  • 184
  • 185
  • 186
  • 187
  • 188
  • 189
  • 190
  • 191
  • 192
  • 193
  • 194
  • 195
  • 196
  • 197
  • 198
  • 199
  • 200
  • 201
  • 202
  • 203
  • 204
  • 205
  • 206
  • 207
  • 208
  • 209
  • 210
  • 211
  • 212
  • 213
  • 214
  • 215
  • 216
  • 217
  • 218
  • 219
  • 220
  • 221
  • 222
  • 223
  • 224
  • 225
  • 226
  • 227
  • 228
  • 229
  • 230
  • 231
  • 232
  • 233
  • 234
  • 235
  • 236
  • 237
  • 238
  • 239
  • 240
  • 241
  • 242
  • 243
  • 244
  • 245
  • 246
  • 247
  • 248
  • 249
  • 250
  • 251
  • 252
  • 253
  • 254
  • 255
  • 256
  • 257
  • 258
  • 259
  • 260
  • 261
  • 262
  • 263
  • 264
  • 265
  • 266
  • 267
  • 268

Web Tools Administrator’s Guide
ix
53-1002756-01
F_Port trunk groups . . . . . . . . . . . . . . . . . . . . . . . . . . . . . . . . . . . . . . 87
Creating and maintaining F_Port trunk groups . . . . . . . . . . . . . 87
Chapter 7
Monitoring Performance
Performance Monitor overview . . . . . . . . . . . . . . . . . . . . . . . . . . . . .89
Basic monitoring . . . . . . . . . . . . . . . . . . . . . . . . . . . . . . . . . . . . .89
Advanced monitoring . . . . . . . . . . . . . . . . . . . . . . . . . . . . . . . . . .90
Performance graphs . . . . . . . . . . . . . . . . . . . . . . . . . . . . . . . . . .90
Predefined performance graphs. . . . . . . . . . . . . . . . . . . . . . . . . 90
User-defined graphs. . . . . . . . . . . . . . . . . . . . . . . . . . . . . . . . . . .93
Canvas configurations . . . . . . . . . . . . . . . . . . . . . . . . . . . . . . . . .93
Opening the Performance Monitor window. . . . . . . . . . . . . . . . . . . .94
Creating basic performance monitor graphs . . . . . . . . . . . . . . . . . .94
Customizing basic monitoring graphs . . . . . . . . . . . . . . . . . . . . . . . .95
Advanced performance monitoring graphs. . . . . . . . . . . . . . . . . . . . 97
Creating SID-DID Performance graphs. . . . . . . . . . . . . . . . . . . . 97
Creating the SCSI vs. IP Traffic graph . . . . . . . . . . . . . . . . . . . . .98
Creating SCSI command graphs . . . . . . . . . . . . . . . . . . . . . . . . .98
Tunnel and TCP performance monitoring graphs . . . . . . . . . . . . . . .99
Tunnel and TCP graph chart properties . . . . . . . . . . . . . . . . . .100
Saving graphs to a canvas . . . . . . . . . . . . . . . . . . . . . . . . . . . . . . . .100
Adding graphs to an existing canvas . . . . . . . . . . . . . . . . . . . . . . . .101
Printing graphs . . . . . . . . . . . . . . . . . . . . . . . . . . . . . . . . . . . . . . . . . 101
Modifying graphs. . . . . . . . . . . . . . . . . . . . . . . . . . . . . . . . . . . . . . . .101
Chapter 8
Administering Zoning
Zoning overview. . . . . . . . . . . . . . . . . . . . . . . . . . . . . . . . . . . . . . . . .103
Basic zones . . . . . . . . . . . . . . . . . . . . . . . . . . . . . . . . . . . . . . . .103
Traffic Isolation zones . . . . . . . . . . . . . . . . . . . . . . . . . . . . . . . .103
LSAN zone requirements. . . . . . . . . . . . . . . . . . . . . . . . . . . . . .104
QoS zone requirements. . . . . . . . . . . . . . . . . . . . . . . . . . . . . . .104
Zoning configurations . . . . . . . . . . . . . . . . . . . . . . . . . . . . . . . . . . . .104
Opening the Zone Admin window . . . . . . . . . . . . . . . . . . . . . . .104
Setting the default zoning mode. . . . . . . . . . . . . . . . . . . . . . . .105