Dell PowerConnect Brocade M6505 Brocade 7.1.0 Web Tools Administrator's Guide - Page 54
Displaying switches in the fabric, Working with Web Tools: recommendations
 |
View all Dell PowerConnect Brocade M6505 manuals
Add to My Manuals
Save this manual to your list of manuals |
Page 54 highlights
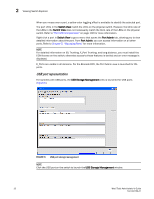
2 Displaying switches in the fabric For these reasons, the time displayed in the port statistics tab might not be refreshed as expected. The counter time indicates only that "this statistics data is retrieved from the switch in this time period." To ensure the correct information, the time field is updated along with the port statistics data after every refresh. The refresh rates are different for each module. Table 6 lists polling rates by module. Though these rates are sample rates, they correctly illustrate variance in the refresh rates throughout Web Tools. TABLE 6 Polling rates Module Polling rate Name Server Zoning Database Fabric Watch Performance Monitor (This feature requires the EGM license.) Port Management FC Routing User-defined; 15 sec minimum 60 sec 45 sec 30 sec 60 sec 45-90 sec, depending on network traffic Displaying switches in the fabric If your fabric has more than one switch, you can open Web Tools from one switch and then access other switches. You can also launch Web Tools from the Brocade Network Advisor client as Element Manager. This lets you manage Web Tool requests where the fabric is in a private network. Launch Web Tools from Brocade Network Advisor if you need to access the fabric from a host that is not in the same network and does not have direct access to the fabric. NOTE If you open switches, running Fabric OS v4.4.x or later, from a Fabric Tree displayed for a version earlier than a v4.4.x switch, some of the features might be disabled. To display switches in the fabric, perform the following steps. 1. Open Web Tools as described in "Opening Web Tools" on page 10 and log in to the switch. 2. If the Fabric Tree is not expanded, click the plus sign (+) in the Fabric Tree to view all the switches in the fabric. 3. Click a switch in the Fabric Tree. A separate browser dialog box displays the selected switch. (If the launch switch is running a Fabric OS version earlier than v5.0.1, the selected switch displays in the same browser window.) The graphic of the selected switch displays in Switch View. Additional switch information displays in the Switch Events and Switch Information tabs. Working with Web Tools: recommendations Brocades makes the following recommendations for working with Web Tools: 26 Web Tools Administrator's Guide 53-1002756-01
-
 1
1 -
2
-
3
-
4
-
5
-
6
-
7
-
8
-
9
-
10
-
11
-
12
-
13
-
14
-
15
-
16
-
17
-
18
-
19
-
20
-
21
-
22
-
23
-
24
-
25
-
26
-
27
-
28
-
29
-
30
-
31
-
32
-
33
-
34
-
35
-
36
-
37
-
38
-
39
-
40
-
41
-
42
-
43
-
44
-
45
-
46
-
47
-
48
-
 49
49 -
 50
50 -
 51
51 -
 52
52 -
 53
53 -
 54
54 -
 55
55 -
 56
56 -
 57
57 -
 58
58 -
 59
59 -
60
-
61
-
62
-
63
-
64
-
65
-
66
-
67
-
68
-
69
-
70
-
71
-
72
-
73
-
74
-
75
-
76
-
77
-
78
-
79
-
80
-
81
-
82
-
83
-
84
-
85
-
86
-
87
-
88
-
89
-
90
-
91
-
92
-
93
-
94
-
95
-
96
-
97
-
98
-
99
-
100
-
101
-
102
-
103
-
104
-
105
-
106
-
107
-
108
-
109
-
110
-
111
-
112
-
113
-
114
-
115
-
116
-
117
-
118
-
119
-
120
-
121
-
122
-
123
-
124
-
125
-
126
-
127
-
128
-
129
-
130
-
131
-
132
-
133
-
134
-
135
-
136
-
137
-
138
-
139
-
140
-
141
-
142
-
143
-
144
-
145
-
146
-
147
-
148
-
149
-
150
-
151
-
152
-
153
-
154
-
155
-
156
-
157
-
158
-
159
-
160
-
161
-
162
-
163
-
164
-
165
-
166
-
167
-
168
-
169
-
170
-
171
-
172
-
173
-
174
-
175
-
176
-
177
-
178
-
179
-
180
-
181
-
182
-
183
-
184
-
185
-
186
-
187
-
188
-
189
-
190
-
191
-
192
-
193
-
194
-
195
-
196
-
197
-
198
-
199
-
200
-
201
-
202
-
203
-
204
-
205
-
206
-
207
-
208
-
209
-
210
-
211
-
212
-
213
-
214
-
215
-
216
-
217
-
218
-
219
-
220
-
221
-
222
-
223
-
224
-
225
-
226
-
227
-
228
-
229
-
230
-
231
-
232
-
233
-
234
-
235
-
236
-
237
-
238
-
239
-
240
-
241
-
242
-
243
-
244
-
245
-
246
-
247
-
248
-
249
-
250
-
251
-
252
-
253
-
254
-
255
-
256
-
257
-
258
-
259
-
260
-
261
-
262
-
263
-
264
-
265
-
266
-
267
-
268
 |
 |