Dell PowerConnect Brocade M6505 Brocade 7.1.0 Web Tools Administrator's Guide - Page 119
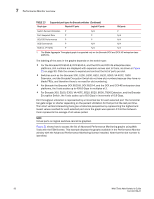
TABLE 11, Performance Monitor overview
 |
View all Dell PowerConnect Brocade M6505 manuals
Add to My Manuals
Save this manual to your list of manuals |
Page 119 highlights
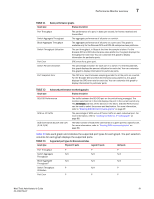
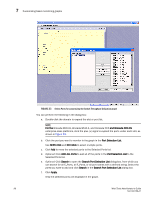
Performance Monitor overview 7 TABLE 11 Basic performance graphs Graph type Display description Port Throughput Switch Aggregate Throughput Blade Aggregate Throughput Switch Throughput Utilization Port Error Switch Percent Utilization Port Snapshot Error The performance of a port, in bytes per second, for frames received and transmitted. The aggregate performance of all ports on a switch. The aggregate performance of all ports on a port card. This graph is available only for the Brocade DCX and DCX-4S enterprise-class platforms. The port throughput, in Gbps at the time the sample is taken. For the Brocade DCX and DCX-4S enterprise-class platforms, this graph displays the throughput for each slot. You can customize this graph to display information for particular ports. CRC errors for a given port. The percentage utilization for each port in a switch. For the Brocade DCX, this graph displays the percent utilization for each slot. You can customize this graph to display information for particular ports. The CRC error count between sampling periods for all the ports on a switch. For the Brocade DCX and DCX-4S enterprise-class platforms, this graph displays the CRC error rate for each slot. You can customize this graph to display information for particular ports. TABLE 12 Advanced performance monitoring graphs Graph type Display description SID/DID Performance SCSI vs. IP Traffic SCSI Commands by port and LUN (R, W, R/W) The traffic between the SID-DID pair on the switch being managed. The member selection list in the LHS displays the port in the current switch only. The All Devices tab lists all the devices in the fabric. SID/DID Performance can be used to select the source and destination. For more information, refer to "Creating SID-DID Performance graphs" on page 97. The percentage of SCSI versus IP frame traffic on each individual port. For more information, refer to "Creating the SCSI vs. IP Traffic graph" on page 98. The total number of read/write commands on a given port to a specific LUN. For more information, refer to "Creating SCSI command graphs" on page 98. Table 13 lists each graph and indicates the supported port types for each graph. The port selection columns for each graph displays the supported ports. TABLE 13 Supported port types for Brocade switches Graph type Physical FC ports Logical FC ports GbE ports Port Throughput P P P Switch Aggregate N/A N/A N/A Throughput Blade Aggregate N/A N/A N/A Throughput1 Switch Throughput P Utilization N/A P Port Error P P P Web Tools Administrator's Guide 91 53-1002756-01
-
 1
1 -
2
-
3
-
4
-
5
-
6
-
7
-
8
-
9
-
10
-
11
-
12
-
13
-
14
-
15
-
16
-
17
-
18
-
19
-
20
-
21
-
22
-
23
-
24
-
25
-
26
-
27
-
28
-
29
-
30
-
31
-
32
-
33
-
34
-
35
-
36
-
37
-
38
-
39
-
40
-
41
-
42
-
43
-
44
-
45
-
46
-
47
-
48
-
49
-
50
-
51
-
52
-
53
-
54
-
55
-
56
-
57
-
58
-
59
-
60
-
61
-
62
-
63
-
64
-
65
-
66
-
67
-
68
-
69
-
70
-
71
-
72
-
73
-
74
-
75
-
76
-
77
-
78
-
79
-
80
-
81
-
82
-
83
-
84
-
85
-
86
-
87
-
88
-
89
-
90
-
91
-
92
-
93
-
94
-
95
-
96
-
97
-
98
-
99
-
100
-
101
-
102
-
103
-
104
-
105
-
106
-
107
-
108
-
109
-
110
-
111
-
112
-
113
-
 114
114 -
 115
115 -
 116
116 -
 117
117 -
 118
118 -
 119
119 -
 120
120 -
 121
121 -
 122
122 -
 123
123 -
 124
124 -
125
-
126
-
127
-
128
-
129
-
130
-
131
-
132
-
133
-
134
-
135
-
136
-
137
-
138
-
139
-
140
-
141
-
142
-
143
-
144
-
145
-
146
-
147
-
148
-
149
-
150
-
151
-
152
-
153
-
154
-
155
-
156
-
157
-
158
-
159
-
160
-
161
-
162
-
163
-
164
-
165
-
166
-
167
-
168
-
169
-
170
-
171
-
172
-
173
-
174
-
175
-
176
-
177
-
178
-
179
-
180
-
181
-
182
-
183
-
184
-
185
-
186
-
187
-
188
-
189
-
190
-
191
-
192
-
193
-
194
-
195
-
196
-
197
-
198
-
199
-
200
-
201
-
202
-
203
-
204
-
205
-
206
-
207
-
208
-
209
-
210
-
211
-
212
-
213
-
214
-
215
-
216
-
217
-
218
-
219
-
220
-
221
-
222
-
223
-
224
-
225
-
226
-
227
-
228
-
229
-
230
-
231
-
232
-
233
-
234
-
235
-
236
-
237
-
238
-
239
-
240
-
241
-
242
-
243
-
244
-
245
-
246
-
247
-
248
-
249
-
250
-
251
-
252
-
253
-
254
-
255
-
256
-
257
-
258
-
259
-
260
-
261
-
262
-
263
-
264
-
265
-
266
-
267
-
268
 |
 |