Dell PowerConnect Brocade M6505 Brocade 7.1.0 Web Tools Administrator's Guide - Page 125
Advanced performance monitoring graphs, Creating SID-DID Performance graphs
 |
View all Dell PowerConnect Brocade M6505 manuals
Add to My Manuals
Save this manual to your list of manuals |
Page 125 highlights
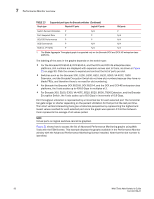
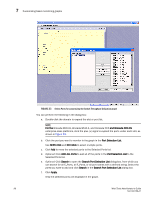
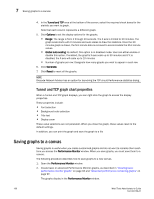
Advanced performance monitoring graphs 7 Advanced performance monitoring graphs This section describes how to create the advanced performance monitor graphs listed in Table 12 on page 91. Because the procedure for creating these graphs differs depending on the type of graph, each type is described separately in the sections that follow. The advanced monitoring graphs are not supported for GbE ports. NOTE You must have an Advanced Performance Monitoring license installed to use the Advance Performance Monitor features. If user-defined Admin Domains are configured, Advanced Performance Monitoring works only in AD255. Creating SID-DID Performance graphs The SID/DID Performance graph displays the traffic between a SID-DID pair on the switch being managed. To create a SID-DID performance graph, perform the following steps. 1. Open the Performance Monitoring window. 2. Select Performance Graphs > Advanced Monitoring > SID/DID Performance. The SID/DID Performance Setup dialog box displays. • To see the end-to-end (EE) monitors that are currently set up on a particular port, proceed to step 3. • To specify the port, Source ID and Domain ID, skip to step 4. NOTE Only the FC ports of the launched switch display in the tree. The All Devices tab lists all the devices in the fabric and lets you select the source and destination. Slot and port information of other switches is not displayed in the tree. 3. Click a port from the Slot/Port or Sid/Did Selection List. a. Drag the selected port into the Enter/drag slot, port number field. b. Click Retrieve preset EE monitors. The current end-to-end monitors for that port are displayed in the "Current EE monitors set for selected port" table. c. Optional: To display a performance graph for the current EE monitors set for the selected port, click a SID-DID pair in the table. You can select multiple Source ID and Destination IDs. Click Select. If you selected multiple SID/DID monitors, click OK in the confirmation dialog box that displays. Skip to step 6. If you do not want to display a performance graph for the current EE monitors set for the selected port, continue with step 4. 4. Select a source ID from the Port or Sid/Did Selection List, and click Add Sid. You can also enter a source ID in the Enter/drag SID number field. 5. Select a destination ID from the Port or Sid/Did Selection List, and click Add Did. You can also enter a destination ID in the Enter/drag DID number field. 6. Click OK. Web Tools Administrator's Guide 97 53-1002756-01
-
 1
1 -
2
-
3
-
4
-
5
-
6
-
7
-
8
-
9
-
10
-
11
-
12
-
13
-
14
-
15
-
16
-
17
-
18
-
19
-
20
-
21
-
22
-
23
-
24
-
25
-
26
-
27
-
28
-
29
-
30
-
31
-
32
-
33
-
34
-
35
-
36
-
37
-
38
-
39
-
40
-
41
-
42
-
43
-
44
-
45
-
46
-
47
-
48
-
49
-
50
-
51
-
52
-
53
-
54
-
55
-
56
-
57
-
58
-
59
-
60
-
61
-
62
-
63
-
64
-
65
-
66
-
67
-
68
-
69
-
70
-
71
-
72
-
73
-
74
-
75
-
76
-
77
-
78
-
79
-
80
-
81
-
82
-
83
-
84
-
85
-
86
-
87
-
88
-
89
-
90
-
91
-
92
-
93
-
94
-
95
-
96
-
97
-
98
-
99
-
100
-
101
-
102
-
103
-
104
-
105
-
106
-
107
-
108
-
109
-
110
-
111
-
112
-
113
-
114
-
115
-
116
-
117
-
118
-
119
-
 120
120 -
 121
121 -
 122
122 -
 123
123 -
 124
124 -
 125
125 -
 126
126 -
 127
127 -
 128
128 -
 129
129 -
 130
130 -
131
-
132
-
133
-
134
-
135
-
136
-
137
-
138
-
139
-
140
-
141
-
142
-
143
-
144
-
145
-
146
-
147
-
148
-
149
-
150
-
151
-
152
-
153
-
154
-
155
-
156
-
157
-
158
-
159
-
160
-
161
-
162
-
163
-
164
-
165
-
166
-
167
-
168
-
169
-
170
-
171
-
172
-
173
-
174
-
175
-
176
-
177
-
178
-
179
-
180
-
181
-
182
-
183
-
184
-
185
-
186
-
187
-
188
-
189
-
190
-
191
-
192
-
193
-
194
-
195
-
196
-
197
-
198
-
199
-
200
-
201
-
202
-
203
-
204
-
205
-
206
-
207
-
208
-
209
-
210
-
211
-
212
-
213
-
214
-
215
-
216
-
217
-
218
-
219
-
220
-
221
-
222
-
223
-
224
-
225
-
226
-
227
-
228
-
229
-
230
-
231
-
232
-
233
-
234
-
235
-
236
-
237
-
238
-
239
-
240
-
241
-
242
-
243
-
244
-
245
-
246
-
247
-
248
-
249
-
250
-
251
-
252
-
253
-
254
-
255
-
256
-
257
-
258
-
259
-
260
-
261
-
262
-
263
-
264
-
265
-
266
-
267
-
268
 |
 |