Dell PowerConnect Brocade M6505 Brocade 7.1.0 Web Tools Administrator's Guide - Page 120
For Brocade the Brocade DCX 8510-8, DCX 8510-4, and the DCX and DCX-4S enterprise-class
 |
View all Dell PowerConnect Brocade M6505 manuals
Add to My Manuals
Save this manual to your list of manuals |
Page 120 highlights
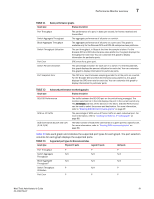
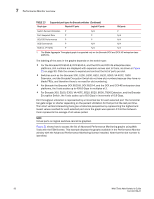
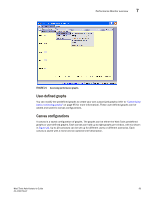
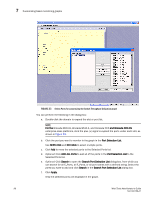
7 Performance Monitor overview TABLE 13 Supported port types for Brocade switches (Continued) Graph type Physical FC ports Logical FC ports GbE ports Switch Percent Utilization P N/A P Port Snapshot Error P P N/A SID/DID Performance P P N/A SCSI Commands P N/A N/A SCSI vs. IP Traffic P N/A N/A 1. The Blade Aggregate Throughput graph is supported only on the Brocade DCX and DCX-4S enterprise-class platforms. The labeling of the axes in the graphs depends on the switch type: • For the Brocade DCX 8510-8, DCX 8510-4, and the DCX and DCX-4S enterprise-class platforms, slot numbers are displayed with expansion arrows next to them, as shown in Figure 21 on page 93. Click the arrows to expand and contract the list of ports per slot. • Switches such as the Brocade 300, 5100, 5300, 6510, 6520, 8000, VA-40FC, 7800 Extension, and the Brocade Encryption Switch do not have slot numbers because they have no blade FRUs, and therefore there is no need for slot numbering. • For Brocade the Brocade DCX 8510-8, DCX 8510-4, and the DCX and DCX-4S enterprise-class platforms, the X-axis scales up to 409.6 Gbps in multiples of 2. • For Brocade 300, 5100, 5300, VA-40FC, 6510, 6520, 8000, 7800 Extension, and the Brocade Encryption Switch, the X-axis scales up to 8.0 Gbps in increments of 0.8 Gbps. Port throughput utilization is represented by a horizontal bar for each selected port The horizontal bar gets longer or shorter depending on the percent utilization for that port at the last poll time. Thin short vertical intersecting bars give a historical perspective by representing the highest and lowest values reached for each selected port since the graph was opened. A third bar between them represents the average of all values polled. NOTE Virtual ports on logical switches cannot be graphed. Figure 21 shows how to access the list of Advanced Performance Monitoring graphs using Web Tools with the EGM license. This example displays the graphs available in the Performance Monitor window with the Advanced Performance Monitoring license installed. Note that the slot number is identified. 92 Web Tools Administrator's Guide 53-1002756-01
-
 1
1 -
2
-
3
-
4
-
5
-
6
-
7
-
8
-
9
-
10
-
11
-
12
-
13
-
14
-
15
-
16
-
17
-
18
-
19
-
20
-
21
-
22
-
23
-
24
-
25
-
26
-
27
-
28
-
29
-
30
-
31
-
32
-
33
-
34
-
35
-
36
-
37
-
38
-
39
-
40
-
41
-
42
-
43
-
44
-
45
-
46
-
47
-
48
-
49
-
50
-
51
-
52
-
53
-
54
-
55
-
56
-
57
-
58
-
59
-
60
-
61
-
62
-
63
-
64
-
65
-
66
-
67
-
68
-
69
-
70
-
71
-
72
-
73
-
74
-
75
-
76
-
77
-
78
-
79
-
80
-
81
-
82
-
83
-
84
-
85
-
86
-
87
-
88
-
89
-
90
-
91
-
92
-
93
-
94
-
95
-
96
-
97
-
98
-
99
-
100
-
101
-
102
-
103
-
104
-
105
-
106
-
107
-
108
-
109
-
110
-
111
-
112
-
113
-
114
-
 115
115 -
 116
116 -
 117
117 -
 118
118 -
 119
119 -
 120
120 -
 121
121 -
 122
122 -
 123
123 -
 124
124 -
 125
125 -
126
-
127
-
128
-
129
-
130
-
131
-
132
-
133
-
134
-
135
-
136
-
137
-
138
-
139
-
140
-
141
-
142
-
143
-
144
-
145
-
146
-
147
-
148
-
149
-
150
-
151
-
152
-
153
-
154
-
155
-
156
-
157
-
158
-
159
-
160
-
161
-
162
-
163
-
164
-
165
-
166
-
167
-
168
-
169
-
170
-
171
-
172
-
173
-
174
-
175
-
176
-
177
-
178
-
179
-
180
-
181
-
182
-
183
-
184
-
185
-
186
-
187
-
188
-
189
-
190
-
191
-
192
-
193
-
194
-
195
-
196
-
197
-
198
-
199
-
200
-
201
-
202
-
203
-
204
-
205
-
206
-
207
-
208
-
209
-
210
-
211
-
212
-
213
-
214
-
215
-
216
-
217
-
218
-
219
-
220
-
221
-
222
-
223
-
224
-
225
-
226
-
227
-
228
-
229
-
230
-
231
-
232
-
233
-
234
-
235
-
236
-
237
-
238
-
239
-
240
-
241
-
242
-
243
-
244
-
245
-
246
-
247
-
248
-
249
-
250
-
251
-
252
-
253
-
254
-
255
-
256
-
257
-
258
-
259
-
260
-
261
-
262
-
263
-
264
-
265
-
266
-
267
-
268
 |
 |