Dell PowerEdge M710 Web Tools Administrator’s Guide - Page 131
Monitoring Performance, In this Performance Monitor overview, Basic monitoring
 |
View all Dell PowerEdge M710 manuals
Add to My Manuals
Save this manual to your list of manuals |
Page 131 highlights
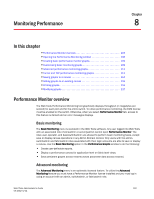
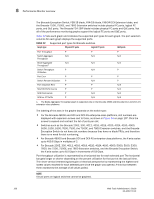
DRAFT: BROCADE CONFIDENTIAL Monitoring Performance Chapter 8 In this chapter •Performance Monitor overview 103 •Opening the Performance Monitoring window 108 •Creating basic performance monitor graphs 109 •Customizing basic monitoring graphs 109 •Advanced performance monitoring graphs 111 •Tunnel and TCP performance monitoring graphs 113 •Saving graphs to a canvas 114 •Adding graphs to an existing canvas 116 •Printing graphs 116 •Modifying graphs 117 Performance Monitor overview The Web Tools Performance Monitoring tool graphically displays throughput (in megabytes per second) for each port and for the entire switch. To utilize performance monitoring, the EGM license must be enabled on the switch. Otherwise, when you select Performance Monitor tab, access to this feature is denied and an error messages displays Basic monitoring The Basic Monitoring menu is standard in the Web Tools software. Any user logged into Web Tools with an associated role of zoneadmin or securityadmin cannot open Performance Monitor. The roles user, operator, and basicswitchadmin are allowed to perform basic monitoring tasks, except save or display canvas operations in any Admin Domain context. Only users with the admin, switchadmin and fabricadmin roles associated with their login accounts are able to save or display a canvas. Use the Basic Monitoring option in the Performance Graphs window to do the following: • Create user-definable reports. • Display a performance canvas for application-level or fabric-level views. • Save persistent graphs across restarts (saves parameter data across restarts). Advanced monitoring The Advanced Monitoring menu is an optionally licensed feature. To utilize the Advanced Monitoring feature you must have a Performance Monitor license installed and you must log in using an account with an admin, switchadmin, or fabricadmin role. Web Tools Administrator's Guide 103 53-1001772-01
-
 1
1 -
2
-
3
-
4
-
5
-
6
-
7
-
8
-
9
-
10
-
11
-
12
-
13
-
14
-
15
-
16
-
17
-
18
-
19
-
20
-
21
-
22
-
23
-
24
-
25
-
26
-
27
-
28
-
29
-
30
-
31
-
32
-
33
-
34
-
35
-
36
-
37
-
38
-
39
-
40
-
41
-
42
-
43
-
44
-
45
-
46
-
47
-
48
-
49
-
50
-
51
-
52
-
53
-
54
-
55
-
56
-
57
-
58
-
59
-
60
-
61
-
62
-
63
-
64
-
65
-
66
-
67
-
68
-
69
-
70
-
71
-
72
-
73
-
74
-
75
-
76
-
77
-
78
-
79
-
80
-
81
-
82
-
83
-
84
-
85
-
86
-
87
-
88
-
89
-
90
-
91
-
92
-
93
-
94
-
95
-
96
-
97
-
98
-
99
-
100
-
101
-
102
-
103
-
104
-
105
-
106
-
107
-
108
-
109
-
110
-
111
-
112
-
113
-
114
-
115
-
116
-
117
-
118
-
119
-
120
-
121
-
122
-
123
-
124
-
125
-
 126
126 -
 127
127 -
 128
128 -
 129
129 -
 130
130 -
 131
131 -
 132
132 -
 133
133 -
 134
134 -
 135
135 -
 136
136 -
137
-
138
-
139
-
140
-
141
-
142
-
143
-
144
-
145
-
146
-
147
-
148
-
149
-
150
-
151
-
152
-
153
-
154
-
155
-
156
-
157
-
158
-
159
-
160
-
161
-
162
-
163
-
164
-
165
-
166
-
167
-
168
-
169
-
170
-
171
-
172
-
173
-
174
-
175
-
176
-
177
-
178
-
179
-
180
-
181
-
182
-
183
-
184
-
185
-
186
-
187
-
188
-
189
-
190
-
191
-
192
-
193
-
194
-
195
-
196
-
197
-
198
-
199
-
200
-
201
-
202
-
203
-
204
-
205
-
206
-
207
-
208
-
209
-
210
-
211
-
212
-
213
-
214
-
215
-
216
-
217
-
218
-
219
-
220
-
221
-
222
-
223
-
224
-
225
-
226
-
227
-
228
-
229
-
230
-
231
-
232
-
233
-
234
-
235
-
236
-
237
-
238
-
239
-
240
-
241
-
242
-
243
-
244
-
245
-
246
-
247
-
248
-
249
-
250
-
251
-
252
-
253
-
254
-
255
-
256
-
257
-
258
-
259
-
260
-
261
-
262
-
263
-
264
-
265
-
266
-
267
-
268
-
269
-
270
-
271
-
272
-
273
-
274
-
275
-
276
-
277
-
278
-
279
-
280
-
281
-
282
-
283
-
284
-
285
-
286
-
287
-
288
-
289
-
290
-
291
-
292
-
293
-
294
-
295
-
296
-
297
-
298
-
299
-
300
-
301
-
302
-
303
-
304
-
305
-
306
-
307
-
308
-
309
-
310
 |
 |
