Dell PowerEdge M710 Web Tools Administrator’s Guide - Page 140
Creating the SCSI vs. IP Traffic graph, Creating SCSI command graphs, SCSI vs. IP Traffic Setup
 |
View all Dell PowerEdge M710 manuals
Add to My Manuals
Save this manual to your list of manuals |
Page 140 highlights
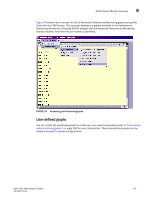
DRAFT: BROCADE CONFIDENTIAL 8 Advanced performance monitoring graphs You can also enter a destination ID in the Enter/drag DID number field. 6. Click OK. If you selected multiple EE monitors, SIDs, or PIDs, a confirmation dialog box displays, reminding you that one graph is opened for each selection. 7. Click Yes to display the graphs. 8. When you close a graph, a dialog box asks if you want to save the monitor. If you click OK, the monitor is saved, and persists if the switch is restarted. Creating the SCSI vs. IP Traffic graph The SCSI vs. IP Traffic graph displays the SCSI versus IP traffic for selected ports. For Brocade 48000 and Brocade DCX and DCX-4S enterprise-class platforms, the slot and port name are identified in the graph. In a trunk group, the SCSI vs. IP Traffic graph displays only the master port and not the slave ports. Use the following procedure to create a SCSI vs. IP Traffic graph. 1. Open the Performance Monitoring window. 2. Select Performance Graphs > Advanced Monitoring > SCSI vs. IP Traffic. The SCSI vs. IP Traffic Setup dialog box displays. This dialog box is similar to that shown in Figure 36 on page 110. 3. Double-click the domain to expand the slot/port list. NOTE For Brocade 48000 and Brocade DCX and DCX-4S enterprise-class platforms, click the plus (+) signs to expand the ports under each slot, as shown in Figure 36. 4. Click the port you want to monitor in the graph in the Port Selection List. Use Shift+click and Ctrl+click to select multiple ports. 5. Click Add to move the selected ports to the Selected Ports list. 6. Optional: Click ADD ALL Ports to add all of the ports in the Port Selection List to the Selected Ports list. 7. Optional: Click Search to open the Search Port Selection List dialog box, from which you can search for all E_Ports, all F_Ports, or all port names with a defined string. Select the ports you want to add and click Search in the Search Port Selection List dialog box. 8. Click Apply in the SCSI vs. IP Traffic Setup dialog box. Only the selected ports are displayed in the SCSI vs. IP traffic graph. Creating SCSI command graphs This graph displays the total number of read or write (or both) commands on a given port or to a specific LUN on a given port. Use the following procedure to create a SCSI command graph. 112 Web Tools Administrator's Guide 53-1001772-01
-
 1
1 -
2
-
3
-
4
-
5
-
6
-
7
-
8
-
9
-
10
-
11
-
12
-
13
-
14
-
15
-
16
-
17
-
18
-
19
-
20
-
21
-
22
-
23
-
24
-
25
-
26
-
27
-
28
-
29
-
30
-
31
-
32
-
33
-
34
-
35
-
36
-
37
-
38
-
39
-
40
-
41
-
42
-
43
-
44
-
45
-
46
-
47
-
48
-
49
-
50
-
51
-
52
-
53
-
54
-
55
-
56
-
57
-
58
-
59
-
60
-
61
-
62
-
63
-
64
-
65
-
66
-
67
-
68
-
69
-
70
-
71
-
72
-
73
-
74
-
75
-
76
-
77
-
78
-
79
-
80
-
81
-
82
-
83
-
84
-
85
-
86
-
87
-
88
-
89
-
90
-
91
-
92
-
93
-
94
-
95
-
96
-
97
-
98
-
99
-
100
-
101
-
102
-
103
-
104
-
105
-
106
-
107
-
108
-
109
-
110
-
111
-
112
-
113
-
114
-
115
-
116
-
117
-
118
-
119
-
120
-
121
-
122
-
123
-
124
-
125
-
126
-
127
-
128
-
129
-
130
-
131
-
132
-
133
-
134
-
 135
135 -
 136
136 -
 137
137 -
 138
138 -
 139
139 -
 140
140 -
 141
141 -
 142
142 -
 143
143 -
 144
144 -
 145
145 -
146
-
147
-
148
-
149
-
150
-
151
-
152
-
153
-
154
-
155
-
156
-
157
-
158
-
159
-
160
-
161
-
162
-
163
-
164
-
165
-
166
-
167
-
168
-
169
-
170
-
171
-
172
-
173
-
174
-
175
-
176
-
177
-
178
-
179
-
180
-
181
-
182
-
183
-
184
-
185
-
186
-
187
-
188
-
189
-
190
-
191
-
192
-
193
-
194
-
195
-
196
-
197
-
198
-
199
-
200
-
201
-
202
-
203
-
204
-
205
-
206
-
207
-
208
-
209
-
210
-
211
-
212
-
213
-
214
-
215
-
216
-
217
-
218
-
219
-
220
-
221
-
222
-
223
-
224
-
225
-
226
-
227
-
228
-
229
-
230
-
231
-
232
-
233
-
234
-
235
-
236
-
237
-
238
-
239
-
240
-
241
-
242
-
243
-
244
-
245
-
246
-
247
-
248
-
249
-
250
-
251
-
252
-
253
-
254
-
255
-
256
-
257
-
258
-
259
-
260
-
261
-
262
-
263
-
264
-
265
-
266
-
267
-
268
-
269
-
270
-
271
-
272
-
273
-
274
-
275
-
276
-
277
-
278
-
279
-
280
-
281
-
282
-
283
-
284
-
285
-
286
-
287
-
288
-
289
-
290
-
291
-
292
-
293
-
294
-
295
-
296
-
297
-
298
-
299
-
300
-
301
-
302
-
303
-
304
-
305
-
306
-
307
-
308
-
309
-
310
 |
 |
