Dell PowerEdge M710 Web Tools Administrator’s Guide - Page 137
Creating basic performance monitor graphs, Customizing basic monitoring graphs
 |
View all Dell PowerEdge M710 manuals
Add to My Manuals
Save this manual to your list of manuals |
Page 137 highlights
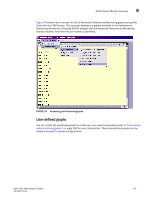
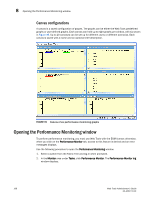
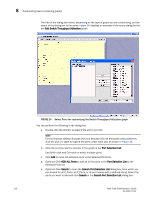
DRAFT: BROCADE CONFIDENTIAL Creating basic performance monitor graphs 8 Creating basic performance monitor graphs Use the following procedure to create the basic performance monitor graphs listed in Table 10 on page 105. 1. Open the Performance Monitoring window. 2. Select Performance Graphs > Basic Monitoring > Graph Type. Depending on the type of graph you select, you might be prompted to select a slot or port for which to create a graph. 3. If prompted, drag the port into the Enter/drag slot,port field, or manually enter the slot and port information in the field, in the format slot,port. NOTE For Brocade 200E, 300, 4012, 4016, 4018, 4020, 4024, 4100, 4900, 5000, 5100, 5300, 7600 switches, the 7500, 7500E and 7800 Extension switches, the 8000, and the Encryption Switch, enter only a port number. 4. Click OK. The graph is displayed in a window in the Performance Monitoring window. Customizing basic monitoring graphs You can customize some of the basic performance monitoring graphs to display information for particular ports. For the Brocade 48000 and Brocade DCX and DCX-4S enterprise-class platforms, you can also customize these graphs to display information for a slot. You can customize the following graphs: • Switch Throughput Utilization • Switch Percent Utilization • Port Snapshot Error The following procedure assumes that you already created one of these customizable graphs. 1. Create or access the graph you want to customize. Refer to "Creating basic performance monitor graphs" on page 109 for instructions on creating a graph. 2. For Brocade 48000 and Brocade DCX and DCX-4S enterprise-class platforms, display the detailed port throughput utilization rates for each port in a slot by clicking the arrows next to a slot. The port information for that slot displays in the graph. NOTE For Brocade 200E, 300 4012, 4016, 4018, 4020, 4024, 4100, 4900, 5000, 5100, 5300, 7600, the 7500, 7500E, and 7800 Extension switches, the 8000, and the Brocade Encryption Switch, proceed to step 3. 3. To display detailed port throughput utilization rates for particular ports only, right-click anywhere in the graph and click Select Ports. The setup dialog box displays, as shown in Figure 36. Web Tools Administrator's Guide 109 53-1001772-01
-
 1
1 -
2
-
3
-
4
-
5
-
6
-
7
-
8
-
9
-
10
-
11
-
12
-
13
-
14
-
15
-
16
-
17
-
18
-
19
-
20
-
21
-
22
-
23
-
24
-
25
-
26
-
27
-
28
-
29
-
30
-
31
-
32
-
33
-
34
-
35
-
36
-
37
-
38
-
39
-
40
-
41
-
42
-
43
-
44
-
45
-
46
-
47
-
48
-
49
-
50
-
51
-
52
-
53
-
54
-
55
-
56
-
57
-
58
-
59
-
60
-
61
-
62
-
63
-
64
-
65
-
66
-
67
-
68
-
69
-
70
-
71
-
72
-
73
-
74
-
75
-
76
-
77
-
78
-
79
-
80
-
81
-
82
-
83
-
84
-
85
-
86
-
87
-
88
-
89
-
90
-
91
-
92
-
93
-
94
-
95
-
96
-
97
-
98
-
99
-
100
-
101
-
102
-
103
-
104
-
105
-
106
-
107
-
108
-
109
-
110
-
111
-
112
-
113
-
114
-
115
-
116
-
117
-
118
-
119
-
120
-
121
-
122
-
123
-
124
-
125
-
126
-
127
-
128
-
129
-
130
-
131
-
 132
132 -
 133
133 -
 134
134 -
 135
135 -
 136
136 -
 137
137 -
 138
138 -
 139
139 -
 140
140 -
 141
141 -
 142
142 -
143
-
144
-
145
-
146
-
147
-
148
-
149
-
150
-
151
-
152
-
153
-
154
-
155
-
156
-
157
-
158
-
159
-
160
-
161
-
162
-
163
-
164
-
165
-
166
-
167
-
168
-
169
-
170
-
171
-
172
-
173
-
174
-
175
-
176
-
177
-
178
-
179
-
180
-
181
-
182
-
183
-
184
-
185
-
186
-
187
-
188
-
189
-
190
-
191
-
192
-
193
-
194
-
195
-
196
-
197
-
198
-
199
-
200
-
201
-
202
-
203
-
204
-
205
-
206
-
207
-
208
-
209
-
210
-
211
-
212
-
213
-
214
-
215
-
216
-
217
-
218
-
219
-
220
-
221
-
222
-
223
-
224
-
225
-
226
-
227
-
228
-
229
-
230
-
231
-
232
-
233
-
234
-
235
-
236
-
237
-
238
-
239
-
240
-
241
-
242
-
243
-
244
-
245
-
246
-
247
-
248
-
249
-
250
-
251
-
252
-
253
-
254
-
255
-
256
-
257
-
258
-
259
-
260
-
261
-
262
-
263
-
264
-
265
-
266
-
267
-
268
-
269
-
270
-
271
-
272
-
273
-
274
-
275
-
276
-
277
-
278
-
279
-
280
-
281
-
282
-
283
-
284
-
285
-
286
-
287
-
288
-
289
-
290
-
291
-
292
-
293
-
294
-
295
-
296
-
297
-
298
-
299
-
300
-
301
-
302
-
303
-
304
-
305
-
306
-
307
-
308
-
309
-
310
 |
 |
