Dell PowerEdge M710 Web Tools Administrator’s Guide - Page 205
Fabric Watch alarm information, Viewing an alarm configuration report, Displaying alarms
 |
View all Dell PowerEdge M710 manuals
Add to My Manuals
Save this manual to your list of manuals |
Page 205 highlights
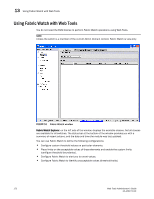
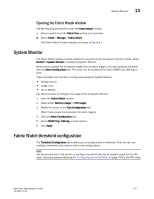
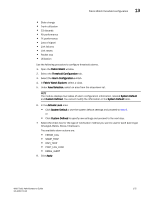
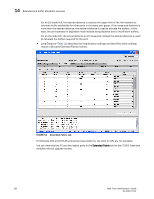
DRAFT: BROCADE CONFIDENTIAL Fabric Watch alarm information 13 5. Select the alarm states for which you want an event to register. If a FRU of the selected type is determined that it is one of the selected states, an event will occur. 6. Select the methods by which you want to be notified about the FRU alarms. For FRUs, the only options are error log and e-mail alert. 7. Click Apply to apply the changes to the switch. A confirmation dialog box displays, asking if you want to apply the changes to the switch. 8. Click OK to save the changes to the switch. Fabric Watch alarm information From Fabric Watch, you can view two types of reports: • Alarm notifications-Displays the alarms that occurred for a selected class or area. • Alarm configuration-Displays threshold and alarm configurations for a selected class or area. Viewing an alarm configuration report Use the Threshold Configuration tab, Configuration Report subtab to display a report of the configuration for a selected class or area with the following information: • Threshold settings (labeled Threshold Configuration) • Notification settings (labeled Action Configuration) • Element settings (not labeled) - You can scroll through this information, but cannot make changes. Use the following procedure to view an alarm configuration report. 1. Open the Fabric Watch window. 2. Select the Threshold Configuration tab. 3. Select a previously configured element from Fabric Watch Explorer (for instructions, refer to "Enabling or disabling threshold alarms for individual elements" on page 176). 4. Under Area Selection, select the alarm area report to be viewed. 5. Select the Configuration Report subtab. This tab displays a report of the configuration for the selected area. Displaying alarms Using the Alarm Notification tab, you can view a list of all alarms that occurred for a selected class or area (Figure 53 on page 172). Table 15 describes the columns in this report. You can click the header of each column to change the way the information is sorted in your view. You can also right-click the column header and select sort options from a menu. Web Tools Administrator's Guide 177 53-1001772-01
-
 1
1 -
2
-
3
-
4
-
5
-
6
-
7
-
8
-
9
-
10
-
11
-
12
-
13
-
14
-
15
-
16
-
17
-
18
-
19
-
20
-
21
-
22
-
23
-
24
-
25
-
26
-
27
-
28
-
29
-
30
-
31
-
32
-
33
-
34
-
35
-
36
-
37
-
38
-
39
-
40
-
41
-
42
-
43
-
44
-
45
-
46
-
47
-
48
-
49
-
50
-
51
-
52
-
53
-
54
-
55
-
56
-
57
-
58
-
59
-
60
-
61
-
62
-
63
-
64
-
65
-
66
-
67
-
68
-
69
-
70
-
71
-
72
-
73
-
74
-
75
-
76
-
77
-
78
-
79
-
80
-
81
-
82
-
83
-
84
-
85
-
86
-
87
-
88
-
89
-
90
-
91
-
92
-
93
-
94
-
95
-
96
-
97
-
98
-
99
-
100
-
101
-
102
-
103
-
104
-
105
-
106
-
107
-
108
-
109
-
110
-
111
-
112
-
113
-
114
-
115
-
116
-
117
-
118
-
119
-
120
-
121
-
122
-
123
-
124
-
125
-
126
-
127
-
128
-
129
-
130
-
131
-
132
-
133
-
134
-
135
-
136
-
137
-
138
-
139
-
140
-
141
-
142
-
143
-
144
-
145
-
146
-
147
-
148
-
149
-
150
-
151
-
152
-
153
-
154
-
155
-
156
-
157
-
158
-
159
-
160
-
161
-
162
-
163
-
164
-
165
-
166
-
167
-
168
-
169
-
170
-
171
-
172
-
173
-
174
-
175
-
176
-
177
-
178
-
179
-
180
-
181
-
182
-
183
-
184
-
185
-
186
-
187
-
188
-
189
-
190
-
191
-
192
-
193
-
194
-
195
-
196
-
197
-
198
-
199
-
 200
200 -
 201
201 -
 202
202 -
 203
203 -
 204
204 -
 205
205 -
 206
206 -
 207
207 -
 208
208 -
 209
209 -
 210
210 -
211
-
212
-
213
-
214
-
215
-
216
-
217
-
218
-
219
-
220
-
221
-
222
-
223
-
224
-
225
-
226
-
227
-
228
-
229
-
230
-
231
-
232
-
233
-
234
-
235
-
236
-
237
-
238
-
239
-
240
-
241
-
242
-
243
-
244
-
245
-
246
-
247
-
248
-
249
-
250
-
251
-
252
-
253
-
254
-
255
-
256
-
257
-
258
-
259
-
260
-
261
-
262
-
263
-
264
-
265
-
266
-
267
-
268
-
269
-
270
-
271
-
272
-
273
-
274
-
275
-
276
-
277
-
278
-
279
-
280
-
281
-
282
-
283
-
284
-
285
-
286
-
287
-
288
-
289
-
290
-
291
-
292
-
293
-
294
-
295
-
296
-
297
-
298
-
299
-
300
-
301
-
302
-
303
-
304
-
305
-
306
-
307
-
308
-
309
-
310
 |
 |
