Dell PowerEdge M710 Web Tools Administrator’s Guide - Page 133
Predefined performance graphs, TABLE 10
 |
View all Dell PowerEdge M710 manuals
Add to My Manuals
Save this manual to your list of manuals |
Page 133 highlights
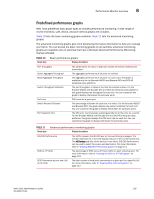
DRAFT: BROCADE CONFIDENTIAL Performance Monitor overview 8 Predefined performance graphs Web Tools predefines basic graph types to simplify performance monitoring. A wide range of end-to-end fabric, LUN, device, and port metrics graphs are included. Table 10 lists the basic monitoring graphs available. Table 11 lists the advanced monitoring graphs. The advanced monitoring graphs give more detailed performance information to help you manage your fabric. You can access the basic monitoring graphs on all switches; advanced monitoring graphs are available only on switches that have a Brocade Advanced Performance Monitoring license activated. TABLE 10 Basic performance graphs Graph type Display description Port Throughput Switch Aggregate Throughput Blade Aggregate Throughput Switch Throughput Utilization Port Error Switch Percent Utilization Port Snapshot Error The performance of a port, in bytes per second, for frames received and transmitted. The aggregate performance of all ports on a switch. The aggregate performance of all ports on a port card. This graph is available only for the Brocade 48000 and Brocade DCX and DCX-4S enterprise-class platforms. The port throughput, in Gbps at the time the sample is taken. For the Brocade 48000 and Brocade DCX and DCX-4S enterprise-class platforms, this graph displays the throughput for each slot. You can customize this graph to display information for particular ports. CRC errors for a given port. The percentage utilization for each port in a switch. For the Brocade 48000 and Brocade DCX, this graph displays the percent utilization for each slot. You can customize this graph to display information for particular ports. The CRC error count between sampling periods for all the ports on a switch. For the Brocade 48000 and Brocade DCX and DCX-4S enterprise-class platforms, this graph displays the CRC error rate for each slot. You can customize this graph to display information for particular ports. TABLE 11 Advanced performance monitoring graphs Graph type Display description SID/DID Performance SCSI vs. IP Traffic SCSI Commands by port and LUN (R, W, R/W) The traffic between the SID-DID pair on the switch being managed. The member selection list in the LHS displays the port in the current switch only. The All Devices tab lists all the devices in the fabric. SID/DID Performance can be used to select the source and destination. For more information, refer to "Creating SID-DID Performance graphs" on page 111. The percentage of SCSI versus IP frame traffic on each individual port. For more information, refer to "Creating the SCSI vs. IP Traffic graph" on page 112. The total number of read/write commands on a given port to a specific LUN. For more information, refer to "Creating SCSI command graphs" on page 112. Web Tools Administrator's Guide 105 53-1001772-01
-
 1
1 -
2
-
3
-
4
-
5
-
6
-
7
-
8
-
9
-
10
-
11
-
12
-
13
-
14
-
15
-
16
-
17
-
18
-
19
-
20
-
21
-
22
-
23
-
24
-
25
-
26
-
27
-
28
-
29
-
30
-
31
-
32
-
33
-
34
-
35
-
36
-
37
-
38
-
39
-
40
-
41
-
42
-
43
-
44
-
45
-
46
-
47
-
48
-
49
-
50
-
51
-
52
-
53
-
54
-
55
-
56
-
57
-
58
-
59
-
60
-
61
-
62
-
63
-
64
-
65
-
66
-
67
-
68
-
69
-
70
-
71
-
72
-
73
-
74
-
75
-
76
-
77
-
78
-
79
-
80
-
81
-
82
-
83
-
84
-
85
-
86
-
87
-
88
-
89
-
90
-
91
-
92
-
93
-
94
-
95
-
96
-
97
-
98
-
99
-
100
-
101
-
102
-
103
-
104
-
105
-
106
-
107
-
108
-
109
-
110
-
111
-
112
-
113
-
114
-
115
-
116
-
117
-
118
-
119
-
120
-
121
-
122
-
123
-
124
-
125
-
126
-
127
-
 128
128 -
 129
129 -
 130
130 -
 131
131 -
 132
132 -
 133
133 -
 134
134 -
 135
135 -
 136
136 -
 137
137 -
 138
138 -
139
-
140
-
141
-
142
-
143
-
144
-
145
-
146
-
147
-
148
-
149
-
150
-
151
-
152
-
153
-
154
-
155
-
156
-
157
-
158
-
159
-
160
-
161
-
162
-
163
-
164
-
165
-
166
-
167
-
168
-
169
-
170
-
171
-
172
-
173
-
174
-
175
-
176
-
177
-
178
-
179
-
180
-
181
-
182
-
183
-
184
-
185
-
186
-
187
-
188
-
189
-
190
-
191
-
192
-
193
-
194
-
195
-
196
-
197
-
198
-
199
-
200
-
201
-
202
-
203
-
204
-
205
-
206
-
207
-
208
-
209
-
210
-
211
-
212
-
213
-
214
-
215
-
216
-
217
-
218
-
219
-
220
-
221
-
222
-
223
-
224
-
225
-
226
-
227
-
228
-
229
-
230
-
231
-
232
-
233
-
234
-
235
-
236
-
237
-
238
-
239
-
240
-
241
-
242
-
243
-
244
-
245
-
246
-
247
-
248
-
249
-
250
-
251
-
252
-
253
-
254
-
255
-
256
-
257
-
258
-
259
-
260
-
261
-
262
-
263
-
264
-
265
-
266
-
267
-
268
-
269
-
270
-
271
-
272
-
273
-
274
-
275
-
276
-
277
-
278
-
279
-
280
-
281
-
282
-
283
-
284
-
285
-
286
-
287
-
288
-
289
-
290
-
291
-
292
-
293
-
294
-
295
-
296
-
297
-
298
-
299
-
300
-
301
-
302
-
303
-
304
-
305
-
306
-
307
-
308
-
309
-
310
 |
 |
