HP BladeSystem bc2800 Embedded Web System User Guide for the HP BladeSystem PC - Page 186
Managing RMON Statistics
 |
View all HP BladeSystem bc2800 manuals
Add to My Manuals
Save this manual to your list of manuals |
Page 186 highlights
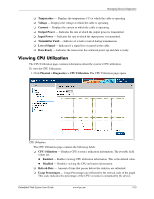
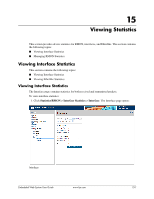
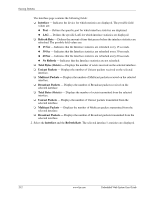
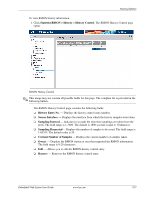
Viewing Statistics ❏ Internal MAC Receive Errors - Displays the number of internal MAC received errors on the selected interface. ❏ Received Pause Frames - Displays the number of received paused frames on the selected interface. ❏ Transmitted Paused Frames - Displays the number of paused frames transmitted from the selected interface. 2. Select the Interface and the Refresh Rate. The selected interface's Etherlike statistics are displayed. Resetting Etherlike Statistics Counters 1. Click Statistics/RMON > Interface Statistics > Etherlike. The Etherlike page opens. 2. Click . The Etherlike statistics counters are cleared. Managing RMON Statistics This section contains the following topics: ■ Viewing RMON Statistics ■ Configuring RMON History ■ Configuring RMON Events ■ Defining RMON Alarms Viewing RMON Statistics The RMON Statistics page contains fields for viewing information about device utilization and errors that occurred on the device. The RMON Statistics contains statistics for both received and transmitted packets. 15-4 www.hp.com Embedded Web System User Guide
-
 1
1 -
2
-
3
-
4
-
5
-
6
-
7
-
8
-
9
-
10
-
11
-
12
-
13
-
14
-
15
-
16
-
17
-
18
-
19
-
20
-
21
-
22
-
23
-
24
-
25
-
26
-
27
-
28
-
29
-
30
-
31
-
32
-
33
-
34
-
35
-
36
-
37
-
38
-
39
-
40
-
41
-
42
-
43
-
44
-
45
-
46
-
47
-
48
-
49
-
50
-
51
-
52
-
53
-
54
-
55
-
56
-
57
-
58
-
59
-
60
-
61
-
62
-
63
-
64
-
65
-
66
-
67
-
68
-
69
-
70
-
71
-
72
-
73
-
74
-
75
-
76
-
77
-
78
-
79
-
80
-
81
-
82
-
83
-
84
-
85
-
86
-
87
-
88
-
89
-
90
-
91
-
92
-
93
-
94
-
95
-
96
-
97
-
98
-
99
-
100
-
101
-
102
-
103
-
104
-
105
-
106
-
107
-
108
-
109
-
110
-
111
-
112
-
113
-
114
-
115
-
116
-
117
-
118
-
119
-
120
-
121
-
122
-
123
-
124
-
125
-
126
-
127
-
128
-
129
-
130
-
131
-
132
-
133
-
134
-
135
-
136
-
137
-
138
-
139
-
140
-
141
-
142
-
143
-
144
-
145
-
146
-
147
-
148
-
149
-
150
-
151
-
152
-
153
-
154
-
155
-
156
-
157
-
158
-
159
-
160
-
161
-
162
-
163
-
164
-
165
-
166
-
167
-
168
-
169
-
170
-
171
-
172
-
173
-
174
-
175
-
176
-
177
-
178
-
179
-
180
-
 181
181 -
 182
182 -
 183
183 -
 184
184 -
 185
185 -
 186
186 -
 187
187 -
 188
188 -
 189
189 -
 190
190 -
 191
191 -
192
-
193
-
194
-
195
-
196
-
197
-
198
-
199
-
200
-
201
-
202
-
203
-
204
-
205
-
206
-
207
-
208
-
209
-
210
-
211
-
212
-
213
-
214
-
215
-
216
 |
 |