HP 6125G HP 6125G & 6125G/XG Blade Switches Network Management and Mon - Page 187
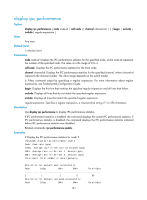
display ipc performance
 |
View all HP 6125G manuals
Add to My Manuals
Save this manual to your list of manuals |
Page 187 highlights
display ipc performance Syntax View display ipc performance { node node-id | self-node } [ channel channel-id ] [ | { begin | exclude | include } regular-expression ] Any view Default level 1: Monitor level Parameters node node-id: Displays the IPC performance statistics for the specified node, where node-id represents the number of the specified node. The value is in the range of 0 to 4. self-node: Displays the IPC performance statistics for the local node. channel channel-id: Displays the IPC performance statistics for the specified channel, where channel-id represents the channel number. The value range depends on the switch model. |: Filters command output by specifying a regular expression. For more information about regular expressions, see Fundamentals Configuration Guide. begin: Displays the first line that matches the specified regular expression and all lines that follow. exclude: Displays all lines that do not match the specified regular expression. include: Displays all lines that match the specified regular expression. regular-expression: Specifies a regular expression, a case-sensitive string of 1 to 256 characters. Description Use display ipc performance to display IPC performance statistics. If IPC performance statistics is enabled, the command displays the current IPC performance statistics. If IPC performance statistics is disabled, the command displays the IPC performance statistics collected before IPC performance statistics was disabled. Related commands: ipc performance enable. Examples # Display the IPC performance statistics for node 1. display ipc performance node 1 Peak: Peak rate (pps) 10Sec: Average rate in the last 10 seconds (pps) 1Min: Average rate in the last 1 minute (pps) 5Min: Average rate in the last 5 minutes (pps) Total-Data: Total number of data (packets) Statistics for packets sent successfully: Peak 10Sec 1Min 5Min Total-Data 1 1 1 0 80 Statistics for packets recieved successfully: Peak 10Sec 1Min 5Min Total-Data 181
-
 1
1 -
2
-
3
-
4
-
5
-
6
-
7
-
8
-
9
-
10
-
11
-
12
-
13
-
14
-
15
-
16
-
17
-
18
-
19
-
20
-
21
-
22
-
23
-
24
-
25
-
26
-
27
-
28
-
29
-
30
-
31
-
32
-
33
-
34
-
35
-
36
-
37
-
38
-
39
-
40
-
41
-
42
-
43
-
44
-
45
-
46
-
47
-
48
-
49
-
50
-
51
-
52
-
53
-
54
-
55
-
56
-
57
-
58
-
59
-
60
-
61
-
62
-
63
-
64
-
65
-
66
-
67
-
68
-
69
-
70
-
71
-
72
-
73
-
74
-
75
-
76
-
77
-
78
-
79
-
80
-
81
-
82
-
83
-
84
-
85
-
86
-
87
-
88
-
89
-
90
-
91
-
92
-
93
-
94
-
95
-
96
-
97
-
98
-
99
-
100
-
101
-
102
-
103
-
104
-
105
-
106
-
107
-
108
-
109
-
110
-
111
-
112
-
113
-
114
-
115
-
116
-
117
-
118
-
119
-
120
-
121
-
122
-
123
-
124
-
125
-
126
-
127
-
128
-
129
-
130
-
131
-
132
-
133
-
134
-
135
-
136
-
137
-
138
-
139
-
140
-
141
-
142
-
143
-
144
-
145
-
146
-
147
-
148
-
149
-
150
-
151
-
152
-
153
-
154
-
155
-
156
-
157
-
158
-
159
-
160
-
161
-
162
-
163
-
164
-
165
-
166
-
167
-
168
-
169
-
170
-
171
-
172
-
173
-
174
-
175
-
176
-
177
-
178
-
179
-
180
-
181
-
 182
182 -
 183
183 -
 184
184 -
 185
185 -
 186
186 -
 187
187 -
 188
188 -
 189
189 -
 190
190 -
 191
191 -
 192
192 -
193
-
194
-
195
-
196
 |
 |