Dell PowerConnect J-8208 Hardware Guide - Page 102
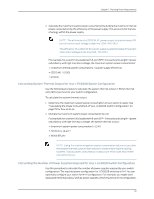
Table 39: Estimated Values for Factors Causing Link Loss
 |
View all Dell PowerConnect J-8208 manuals
Add to My Manuals
Save this manual to your list of manuals |
Page 102 highlights
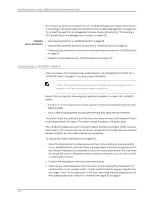
Dell PowerConnect J-Series J-EX8208 Ethernet Switch Hardware Guide Table 39: Estimated Values for Factors Causing Link Loss (continued) Link-Loss Factor Estimated Link-Loss Value Sample (LL) Calculation Values Connector 0.5 dBm This example assumes 5 connectors. Loss for 5 connectors: 5(0.5 dBm) = 2.5 dBm Splice 0.5 dBm This example assumes 2 splices. Loss for two splices: 2(0.5 dBm) = 1dBm Fiber attenuation • Multimode-1 dBm/km • Single mode-0.5 dBm/km Clock Recovery Module (CRM) 1 dBm This example assumes the link is 2 km long. Fiber attenuation for 2 km: • 2 km(1.0 dBm/km) = 2 dBm • 2 km( 0.5 dBm/km) = 1 dBm 1 dBm NOTE: For information about the actual amount of signal loss caused by equipment and other factors, see your vendor documentation for that equipment. 2. Calculate the (P ) by subtracting (LL) from (P ): M B P - LL = P B M 13 dBm - 0.5 dBm [HOL] - 5 (0.5 dBm) - 2 (0.5 dBm) - 2 km (1.0 dBm/km) - 1 dB [CRM] = P M 13 dBm - 0.5 dBm - 2.5 dBm - 1 dBm - 2 dBm - 1 dBm = P M P = 6 dBm M The calculated power margin is greater than zero, indicating that the link has sufficient power for transmission. Also, the power margin value does not exceed the maximum receiver input power. Refer to the specification for your receiver to find the maximum receiver input power. Related • Calculating the J-EX8200 Switch Fiber-Optic Cable Power Budget on page 84 Documentation • Optical Interface Support in J-EX8200 Switches on page 45 • Understanding J-EX8200 Switch Fiber-Optic Cable Signal Loss, Attenuation, and Dispersion on page 72 86
-
 1
1 -
2
-
3
-
4
-
5
-
6
-
7
-
8
-
9
-
10
-
11
-
12
-
13
-
14
-
15
-
16
-
17
-
18
-
19
-
20
-
21
-
22
-
23
-
24
-
25
-
26
-
27
-
28
-
29
-
30
-
31
-
32
-
33
-
34
-
35
-
36
-
37
-
38
-
39
-
40
-
41
-
42
-
43
-
44
-
45
-
46
-
47
-
48
-
49
-
50
-
51
-
52
-
53
-
54
-
55
-
56
-
57
-
58
-
59
-
60
-
61
-
62
-
63
-
64
-
65
-
66
-
67
-
68
-
69
-
70
-
71
-
72
-
73
-
74
-
75
-
76
-
77
-
78
-
79
-
80
-
81
-
82
-
83
-
84
-
85
-
86
-
87
-
88
-
89
-
90
-
91
-
92
-
93
-
94
-
95
-
96
-
 97
97 -
 98
98 -
 99
99 -
 100
100 -
 101
101 -
 102
102 -
 103
103 -
 104
104 -
 105
105 -
 106
106 -
 107
107 -
108
-
109
-
110
-
111
-
112
-
113
-
114
-
115
-
116
-
117
-
118
-
119
-
120
-
121
-
122
-
123
-
124
-
125
-
126
-
127
-
128
-
129
-
130
-
131
-
132
-
133
-
134
-
135
-
136
-
137
-
138
-
139
-
140
-
141
-
142
-
143
-
144
-
145
-
146
-
147
-
148
-
149
-
150
-
151
-
152
-
153
-
154
-
155
-
156
-
157
-
158
-
159
-
160
-
161
-
162
-
163
-
164
-
165
-
166
-
167
-
168
-
169
-
170
-
171
-
172
-
173
-
174
-
175
-
176
-
177
-
178
-
179
-
180
-
181
-
182
-
183
-
184
-
185
-
186
-
187
-
188
-
189
-
190
-
191
-
192
-
193
-
194
-
195
-
196
-
197
-
198
-
199
-
200
-
201
-
202
-
203
-
204
-
205
-
206
-
207
-
208
-
209
-
210
-
211
-
212
-
213
-
214
-
215
-
216
-
217
-
218
-
219
-
220
-
221
-
222
-
223
-
224
-
225
-
226
-
227
-
228
-
229
-
230
-
231
-
232
-
233
-
234
-
235
-
236
-
237
-
238
-
239
-
240
-
241
-
242
-
243
-
244
-
245
-
246
-
247
-
248
-
249
-
250
-
251
-
252
-
253
-
254
-
255
-
256
-
257
-
258
-
259
-
260
-
261
-
262
-
263
-
264
-
265
-
266
-
267
-
268
-
269
-
270
-
271
-
272
-
273
-
274
-
275
-
276
 |
 |