Dell PowerConnect W-IAP92 Dell Instant 6.1.3.4-3.1.0.0 User Guide - Page 202
Client Alerts Link, IDS Link, Network View
 |
View all Dell PowerConnect W-IAP92 manuals
Add to My Manuals
Save this manual to your list of manuals |
Page 202 highlights
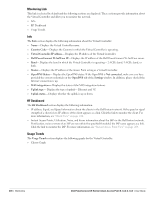
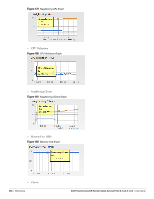
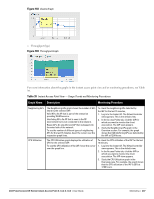
Table 37 Virtual Controller View - Graphs and Monitoring Procedures (Continued) Graph Name Description Monitoring Procedure Throughput The Throughput graph shows the throughput of all networks and IAPs associated with the Virtual Controller for the last 15 minutes. Outgoing traffic - Throughput for outgoing traffic is displayed in green. Outgoing traffic is shown above the median line. Incoming traffic - Throughput for incoming traffic is displayed in blue. Incoming traffic is shown below the median line. To see an enlarged view, click the graph. The enlarged view provides Last, Minimum, Maximum, and Average statistics for the incoming and outgoing traffic throughput of the Virtual Controller for the last 15 minutes. To see the exact throughput of the Dell Instant network at a particular time, hover the cursor over the graph line. To check the throughput of the networks and IAPs associated with the Virtual Controller for the last 15 minutes, 1. Log in to the Instant UI. The Virtual Controller view appears. This is the default view. 2. Study the Throughput graph in the Usage Trends pane. For example, the graph on the left shows 2.0 kbps outgoing traffic throughput at 12:00 hours. It also shows some incoming traffic throughput at the same time. Client Alerts Link For information about the Client Alerts link, see "Clients Tab" on page 21 and Chapter 25, "Alert Types and Management" chapters. IDS Link For information about the IDS link, see "IDS" on page 40. Network View All Wi-Fi networks in the Dell Instant network are listed in the Networks tab. Click the network that you want to monitor. Network View for the selected network appears. Similar to the Virtual Controller view, the Network view also has three tabs- Networks, Access Points, and Clients. The following sections in the Instant UI, provide information about the selected network: Info Usage Trends 202 | Monitoring Dell PowerConnect W-Series Instant Access Point 6.1.3.4-3.1.0.0 | User Guide
-
 1
1 -
2
-
3
-
4
-
5
-
6
-
7
-
8
-
9
-
10
-
11
-
12
-
13
-
14
-
15
-
16
-
17
-
18
-
19
-
20
-
21
-
22
-
23
-
24
-
25
-
26
-
27
-
28
-
29
-
30
-
31
-
32
-
33
-
34
-
35
-
36
-
37
-
38
-
39
-
40
-
41
-
42
-
43
-
44
-
45
-
46
-
47
-
48
-
49
-
50
-
51
-
52
-
53
-
54
-
55
-
56
-
57
-
58
-
59
-
60
-
61
-
62
-
63
-
64
-
65
-
66
-
67
-
68
-
69
-
70
-
71
-
72
-
73
-
74
-
75
-
76
-
77
-
78
-
79
-
80
-
81
-
82
-
83
-
84
-
85
-
86
-
87
-
88
-
89
-
90
-
91
-
92
-
93
-
94
-
95
-
96
-
97
-
98
-
99
-
100
-
101
-
102
-
103
-
104
-
105
-
106
-
107
-
108
-
109
-
110
-
111
-
112
-
113
-
114
-
115
-
116
-
117
-
118
-
119
-
120
-
121
-
122
-
123
-
124
-
125
-
126
-
127
-
128
-
129
-
130
-
131
-
132
-
133
-
134
-
135
-
136
-
137
-
138
-
139
-
140
-
141
-
142
-
143
-
144
-
145
-
146
-
147
-
148
-
149
-
150
-
151
-
152
-
153
-
154
-
155
-
156
-
157
-
158
-
159
-
160
-
161
-
162
-
163
-
164
-
165
-
166
-
167
-
168
-
169
-
170
-
171
-
172
-
173
-
174
-
175
-
176
-
177
-
178
-
179
-
180
-
181
-
182
-
183
-
184
-
185
-
186
-
187
-
188
-
189
-
190
-
191
-
192
-
193
-
194
-
195
-
196
-
 197
197 -
 198
198 -
 199
199 -
 200
200 -
 201
201 -
 202
202 -
 203
203 -
 204
204 -
 205
205 -
 206
206 -
 207
207 -
208
-
209
-
210
-
211
-
212
-
213
-
214
-
215
-
216
-
217
-
218
-
219
-
220
-
221
-
222
-
223
-
224
-
225
-
226
-
227
-
228
-
229
-
230
-
231
-
232
-
233
-
234
-
235
-
236
-
237
-
238
-
239
-
240
-
241
-
242
-
243
-
244
-
245
-
246
 |
 |
