Dell PowerConnect W-IAP92 Dell Instant 6.1.3.4-3.1.0.0 User Guide - Page 207
Table 39
 |
View all Dell PowerConnect W-IAP92 manuals
Add to My Manuals
Save this manual to your list of manuals |
Page 207 highlights
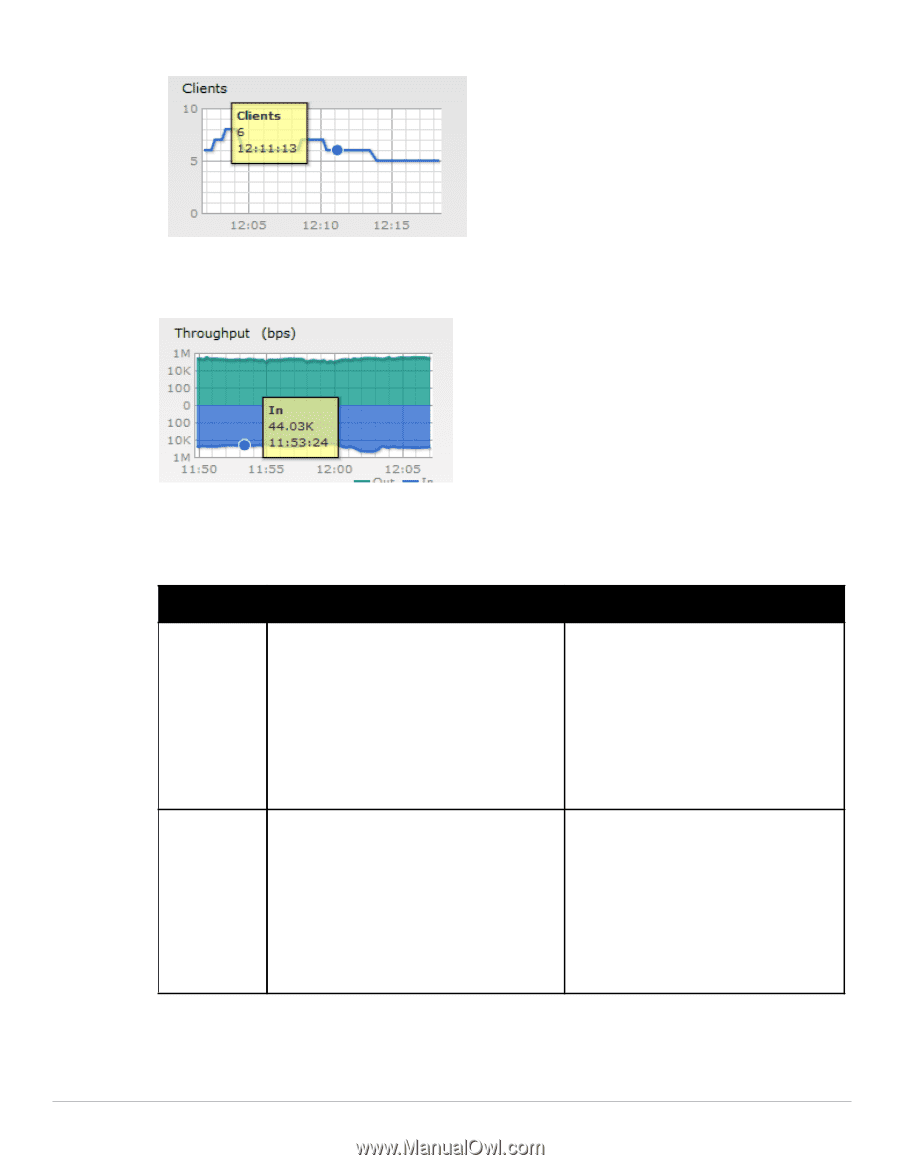
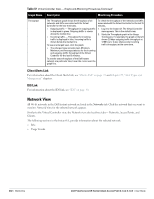
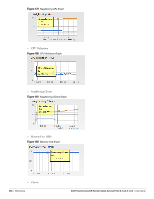
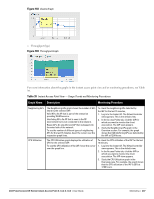
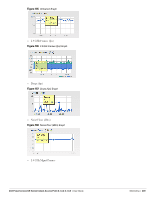
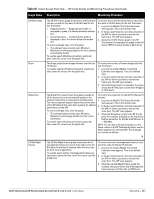
Figure 183 Clients Graph Throughput (bps) Figure 184 Throughput Graph For more information about the graphs in the instant access point view and or monitoring procedures, see Table 39. Table 39 Instant Access Point View - Usage Trends and Monitoring Procedures Graph Name Description Monitoring Procedure Neighboring APs The Neighboring APs graph shows the number of APs heard by the selected IAP: Valid APs: An AP that is part of the enterprise providing WLAN service. Interfering APs: An AP that is seen in the RF environment but is not connected to the network. Rogue APs: An unauthorized AP that is plugged into the wired side of the network. To see the number of different types of neighboring APs for the last 15 minutes, hover the cursor over the respective graph lines. To check the neighboring APs detected by the IAP for the last 15 minutes, 1. Log in to the Instant UI. The Virtual Controller view appears. This is the default view. 2. In the Access Points tab, click the IAP for which you want to monitor the client association. The IAP view appears. 3. Study the Neighboring APs graph in the Overview section. For example, the graph shows that 148 interfering APs are detected by the IAP at 12:04 hours. CPU Utilization The CPU Utilization graph displays the utilization of CPU for the selected IAP. To see the CPU utilization of the IAP, hover the cursor over the graph line. To check the CPU utilization of the IAP for the last 15 minutes, 1. Log in to the Instant UI. The Virtual Controller view appears. This is the default view. 2. In the Access Points tab, click the IAP for which you want to monitor the client association. The IAP view appears. 3. Study the CPU Utilization graph in the Overview pane. For example, the graph shows that the CPU utilization of the IAP is 30% at 12:09 hours. Dell PowerConnect W-Series Instant Access Point 6.1.3.4-3.1.0.0 | User Guide Monitoring | 207
-
 1
1 -
2
-
3
-
4
-
5
-
6
-
7
-
8
-
9
-
10
-
11
-
12
-
13
-
14
-
15
-
16
-
17
-
18
-
19
-
20
-
21
-
22
-
23
-
24
-
25
-
26
-
27
-
28
-
29
-
30
-
31
-
32
-
33
-
34
-
35
-
36
-
37
-
38
-
39
-
40
-
41
-
42
-
43
-
44
-
45
-
46
-
47
-
48
-
49
-
50
-
51
-
52
-
53
-
54
-
55
-
56
-
57
-
58
-
59
-
60
-
61
-
62
-
63
-
64
-
65
-
66
-
67
-
68
-
69
-
70
-
71
-
72
-
73
-
74
-
75
-
76
-
77
-
78
-
79
-
80
-
81
-
82
-
83
-
84
-
85
-
86
-
87
-
88
-
89
-
90
-
91
-
92
-
93
-
94
-
95
-
96
-
97
-
98
-
99
-
100
-
101
-
102
-
103
-
104
-
105
-
106
-
107
-
108
-
109
-
110
-
111
-
112
-
113
-
114
-
115
-
116
-
117
-
118
-
119
-
120
-
121
-
122
-
123
-
124
-
125
-
126
-
127
-
128
-
129
-
130
-
131
-
132
-
133
-
134
-
135
-
136
-
137
-
138
-
139
-
140
-
141
-
142
-
143
-
144
-
145
-
146
-
147
-
148
-
149
-
150
-
151
-
152
-
153
-
154
-
155
-
156
-
157
-
158
-
159
-
160
-
161
-
162
-
163
-
164
-
165
-
166
-
167
-
168
-
169
-
170
-
171
-
172
-
173
-
174
-
175
-
176
-
177
-
178
-
179
-
180
-
181
-
182
-
183
-
184
-
185
-
186
-
187
-
188
-
189
-
190
-
191
-
192
-
193
-
194
-
195
-
196
-
197
-
198
-
199
-
200
-
201
-
 202
202 -
 203
203 -
 204
204 -
 205
205 -
 206
206 -
 207
207 -
 208
208 -
 209
209 -
 210
210 -
 211
211 -
 212
212 -
213
-
214
-
215
-
216
-
217
-
218
-
219
-
220
-
221
-
222
-
223
-
224
-
225
-
226
-
227
-
228
-
229
-
230
-
231
-
232
-
233
-
234
-
235
-
236
-
237
-
238
-
239
-
240
-
241
-
242
-
243
-
244
-
245
-
246
 |
 |