Dell PowerConnect W-IAP92 Dell Instant 6.1.3.4-3.1.0.0 User Guide - Page 212
Client View, Table 40
 |
View all Dell PowerConnect W-IAP92 manuals
Add to My Manuals
Save this manual to your list of manuals |
Page 212 highlights
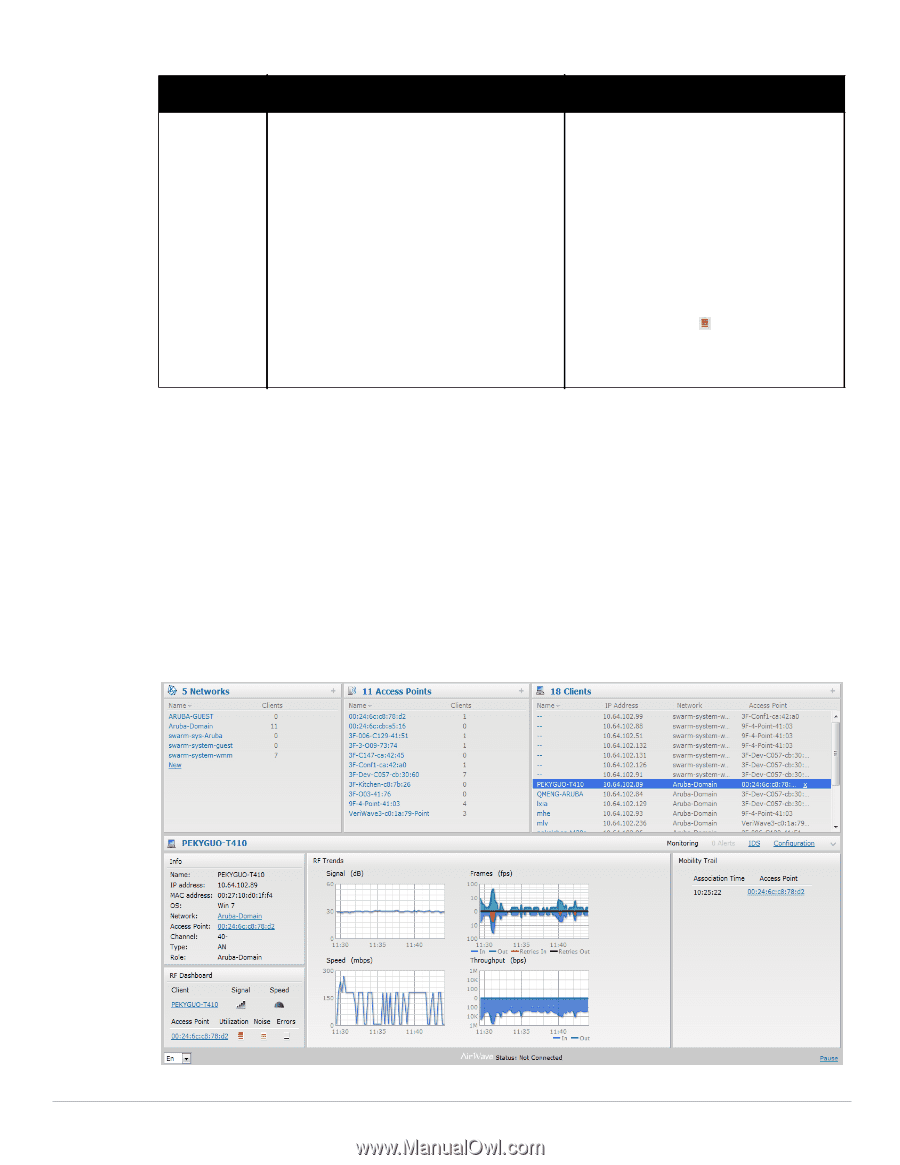
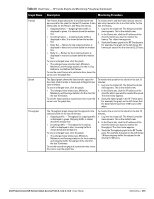
Table 40 Instant Access Point View - RF Trends Graphs and Monitoring Procedures (Continued) Graph Name Description Monitoring Procedure Errors The Errors graph shows the errors that occurred while receiving the frames for the last 15 minutes. The errors are measured in frames per second. To see an enlarged view, click the graph. The enlarged view provides Last, Minimum, Maximum, and Average statistics for the In and Out frames. To see the exact utilization percent at a particular time, hover the cursor over the graph line. To monitor the errors for the IAP for the last 15 minutes, 1. Log in to the WebUI. The Virtual Controller view appears. This is the default view. 2. In the Access Points tab, click the name link of the IAP for which you want to monitor the errors. The IAP view appears. 3. Study the Errors graph in the RF Trends pane. For example, the graph on the left shows that the errors for the IAP at 22:48 hours is 9514.0 frames per second. NOTE: You can also click the rectangle icon under the Errors column in the RF Dashboard pane to see the Errors graph for the selected IAP. Client View In the Virtual Controller view, all clients in the Dell Instant network are listed in the Clients tab. Click the IP address of the client that you want to monitor. Client view for that client appears. The Client view has three tabs- Networks, Access Points, and Clients. The following sections in the Instant UI provide information about the selected client: Info RF Dashboard RF Trends Usage Trends Figure 191 Client View 212 | Monitoring Dell PowerConnect W-Series Instant Access Point 6.1.3.4-3.1.0.0 | User Guide
-
 1
1 -
2
-
3
-
4
-
5
-
6
-
7
-
8
-
9
-
10
-
11
-
12
-
13
-
14
-
15
-
16
-
17
-
18
-
19
-
20
-
21
-
22
-
23
-
24
-
25
-
26
-
27
-
28
-
29
-
30
-
31
-
32
-
33
-
34
-
35
-
36
-
37
-
38
-
39
-
40
-
41
-
42
-
43
-
44
-
45
-
46
-
47
-
48
-
49
-
50
-
51
-
52
-
53
-
54
-
55
-
56
-
57
-
58
-
59
-
60
-
61
-
62
-
63
-
64
-
65
-
66
-
67
-
68
-
69
-
70
-
71
-
72
-
73
-
74
-
75
-
76
-
77
-
78
-
79
-
80
-
81
-
82
-
83
-
84
-
85
-
86
-
87
-
88
-
89
-
90
-
91
-
92
-
93
-
94
-
95
-
96
-
97
-
98
-
99
-
100
-
101
-
102
-
103
-
104
-
105
-
106
-
107
-
108
-
109
-
110
-
111
-
112
-
113
-
114
-
115
-
116
-
117
-
118
-
119
-
120
-
121
-
122
-
123
-
124
-
125
-
126
-
127
-
128
-
129
-
130
-
131
-
132
-
133
-
134
-
135
-
136
-
137
-
138
-
139
-
140
-
141
-
142
-
143
-
144
-
145
-
146
-
147
-
148
-
149
-
150
-
151
-
152
-
153
-
154
-
155
-
156
-
157
-
158
-
159
-
160
-
161
-
162
-
163
-
164
-
165
-
166
-
167
-
168
-
169
-
170
-
171
-
172
-
173
-
174
-
175
-
176
-
177
-
178
-
179
-
180
-
181
-
182
-
183
-
184
-
185
-
186
-
187
-
188
-
189
-
190
-
191
-
192
-
193
-
194
-
195
-
196
-
197
-
198
-
199
-
200
-
201
-
202
-
203
-
204
-
205
-
206
-
 207
207 -
 208
208 -
 209
209 -
 210
210 -
 211
211 -
 212
212 -
 213
213 -
 214
214 -
 215
215 -
 216
216 -
 217
217 -
218
-
219
-
220
-
221
-
222
-
223
-
224
-
225
-
226
-
227
-
228
-
229
-
230
-
231
-
232
-
233
-
234
-
235
-
236
-
237
-
238
-
239
-
240
-
241
-
242
-
243
-
244
-
245
-
246
 |
 |