HP Integrity Superdome 2 HP Integrity Superdome 2 Onboard Administrator User G - Page 123
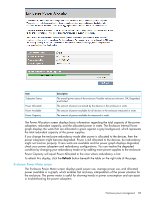
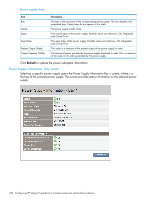
Enclosure Power Meter screen
 |
View all HP Integrity Superdome 2 manuals
Add to My Manuals
Save this manual to your list of manuals |
Page 123 highlights
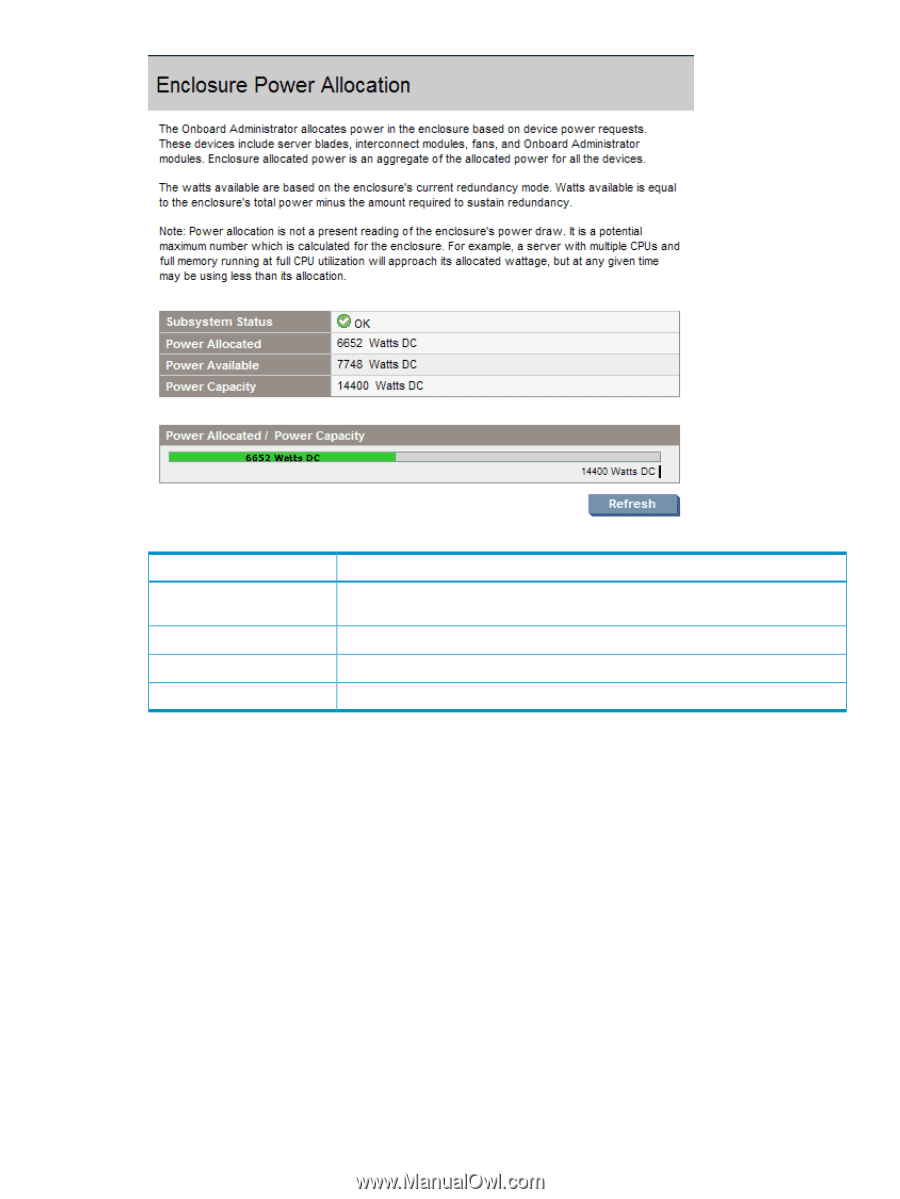
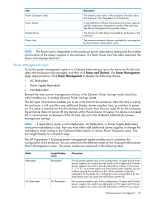
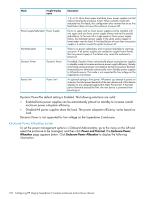
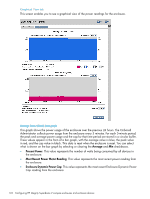
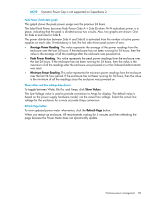
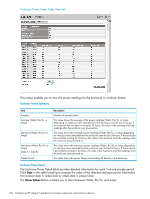
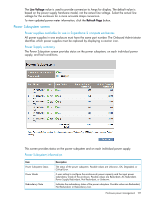
Item Subsystem Status Power Allocated Power Available Power Capacity Description The overall power status of the enclosure. Possible values are unknown, OK, Degraded, and Failed. The amount of power consumed by the devices in the enclosure in watts. The amount of power available for all devices in the enclosure measured in watts. The amount of power available for measured in watts. The Power Allocation screen displays basic information regarding the total capacity of the power subsystem, redundant capacity, and the allocated power in watts. The Enclosure Internal Power graph displays the watts that are allocated in green against a gray background, which represents the total redundant capacity of the power supplies. If you change the enclosure redundancy mode after power is allocated to the devices, then the power subsystem might become degraded. Power is still allocated to the devices, but redundancy might not function properly. If zero watts are available and the power graph displays degraded, check your power subsystem and redundancy configurations. You can resolve the degraded condition by changing your redundancy mode or by adding more power supplies to the enclosure. Power Capacity will equal Power Allocated in the case where redundancy is lost. To refresh this display, click the Refresh button beneath the table on the right side of the page. Enclosure Power Meter screen The Enclosure Power Meter screen displays peak power use, average power use, and allocated power available in a graph, which enables fast and easy interpretation of the power situation for the enclosure. The power meter is useful for showing trends in power consumption and can assist in troubleshooting the power subsystem. Enclosure power management 123
-
 1
1 -
2
-
3
-
4
-
5
-
6
-
7
-
8
-
9
-
10
-
11
-
12
-
13
-
14
-
15
-
16
-
17
-
18
-
19
-
20
-
21
-
22
-
23
-
24
-
25
-
26
-
27
-
28
-
29
-
30
-
31
-
32
-
33
-
34
-
35
-
36
-
37
-
38
-
39
-
40
-
41
-
42
-
43
-
44
-
45
-
46
-
47
-
48
-
49
-
50
-
51
-
52
-
53
-
54
-
55
-
56
-
57
-
58
-
59
-
60
-
61
-
62
-
63
-
64
-
65
-
66
-
67
-
68
-
69
-
70
-
71
-
72
-
73
-
74
-
75
-
76
-
77
-
78
-
79
-
80
-
81
-
82
-
83
-
84
-
85
-
86
-
87
-
88
-
89
-
90
-
91
-
92
-
93
-
94
-
95
-
96
-
97
-
98
-
99
-
100
-
101
-
102
-
103
-
104
-
105
-
106
-
107
-
108
-
109
-
110
-
111
-
112
-
113
-
114
-
115
-
116
-
117
-
 118
118 -
 119
119 -
 120
120 -
 121
121 -
 122
122 -
 123
123 -
 124
124 -
 125
125 -
 126
126 -
 127
127 -
 128
128 -
129
-
130
-
131
-
132
-
133
-
134
-
135
-
136
-
137
-
138
-
139
-
140
-
141
-
142
-
143
-
144
-
145
-
146
-
147
-
148
-
149
-
150
-
151
-
152
-
153
-
154
-
155
-
156
-
157
-
158
-
159
-
160
-
161
-
162
-
163
-
164
-
165
-
166
-
167
-
168
-
169
-
170
-
171
-
172
-
173
-
174
-
175
-
176
-
177
-
178
-
179
-
180
-
181
-
182
-
183
-
184
-
185
-
186
-
187
-
188
-
189
-
190
-
191
 |
 |