HP Integrity Superdome 2 HP Integrity Superdome 2 Onboard Administrator User G - Page 125
The label Peak Power becomes Peak Power Side A + Side B when, Average Power Reading
 |
View all HP Integrity Superdome 2 manuals
Add to My Manuals
Save this manual to your list of manuals |
Page 125 highlights
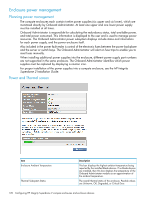
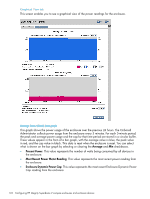
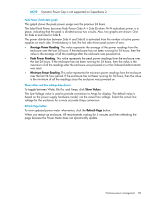
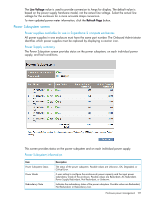
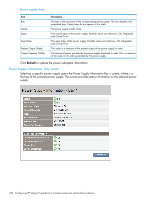
NOTE: Dynamic Power Cap is not supported on Superdome 2. Peak Power (Total) data graph This graph shows the peak power usage over the previous 24 hours. The label Peak Power becomes Peak Power (Side A + Side B) when N+N redundant power is in place, indicating that the peak is divided across two circuits. Also, two graphs are shown: One for Side A and one for Side B. The power distribution between Side A and Side B is estimated from the number of active power supplies on each side. If redundancy is lost, the lost side shows peak power of zero. • Average Power Reading: This value represents the average of the power readings from the enclosure over the last 24 hours. If the enclosure has not been running for 24 hours, then the value is the average of all the readings after the enclosure was powered on. • Peak Power Reading: This value represents the peak power readings from the enclosure over the last 24 hours. If the enclosure has not been running for 24 hours, then the value is the maximum of all the readings after the enclosure was powered on or the Onboard Administrator was reset. • Minimum Power Reading: This value represents the minimum power readings from the enclosure over the last 24 hour period. If the enclosure has not been running for 24 hours, then the value is the minimum of all the readings since the enclosure was powered on. Show values and Line voltage drop-downs To toggle between Watts, Btu/hr, and Amps, click Show Values. The Line Voltage value is used to provide conversion to Amps for display. The default value is based on the power supply hardware model, not the actual line voltage. Select the actual line voltage for the enclosure for a more accurate Amps conversion. Refresh Page button To view updated power meter information, click the Refresh Page button. When you restart an enclosure, HP recommends waiting for 5 minutes and then refreshing the page because the Power Meter does not dynamically update. Enclosure power management 125
-
 1
1 -
2
-
3
-
4
-
5
-
6
-
7
-
8
-
9
-
10
-
11
-
12
-
13
-
14
-
15
-
16
-
17
-
18
-
19
-
20
-
21
-
22
-
23
-
24
-
25
-
26
-
27
-
28
-
29
-
30
-
31
-
32
-
33
-
34
-
35
-
36
-
37
-
38
-
39
-
40
-
41
-
42
-
43
-
44
-
45
-
46
-
47
-
48
-
49
-
50
-
51
-
52
-
53
-
54
-
55
-
56
-
57
-
58
-
59
-
60
-
61
-
62
-
63
-
64
-
65
-
66
-
67
-
68
-
69
-
70
-
71
-
72
-
73
-
74
-
75
-
76
-
77
-
78
-
79
-
80
-
81
-
82
-
83
-
84
-
85
-
86
-
87
-
88
-
89
-
90
-
91
-
92
-
93
-
94
-
95
-
96
-
97
-
98
-
99
-
100
-
101
-
102
-
103
-
104
-
105
-
106
-
107
-
108
-
109
-
110
-
111
-
112
-
113
-
114
-
115
-
116
-
117
-
118
-
119
-
 120
120 -
 121
121 -
 122
122 -
 123
123 -
 124
124 -
 125
125 -
 126
126 -
 127
127 -
 128
128 -
 129
129 -
 130
130 -
131
-
132
-
133
-
134
-
135
-
136
-
137
-
138
-
139
-
140
-
141
-
142
-
143
-
144
-
145
-
146
-
147
-
148
-
149
-
150
-
151
-
152
-
153
-
154
-
155
-
156
-
157
-
158
-
159
-
160
-
161
-
162
-
163
-
164
-
165
-
166
-
167
-
168
-
169
-
170
-
171
-
172
-
173
-
174
-
175
-
176
-
177
-
178
-
179
-
180
-
181
-
182
-
183
-
184
-
185
-
186
-
187
-
188
-
189
-
190
-
191
 |
 |