HP Integrity Superdome 2 HP Integrity Superdome 2 Onboard Administrator User G - Page 126
Enclosure Power Meter Table View tab, Show Values
 |
View all HP Integrity Superdome 2 manuals
Add to My Manuals
Save this manual to your list of manuals |
Page 126 highlights
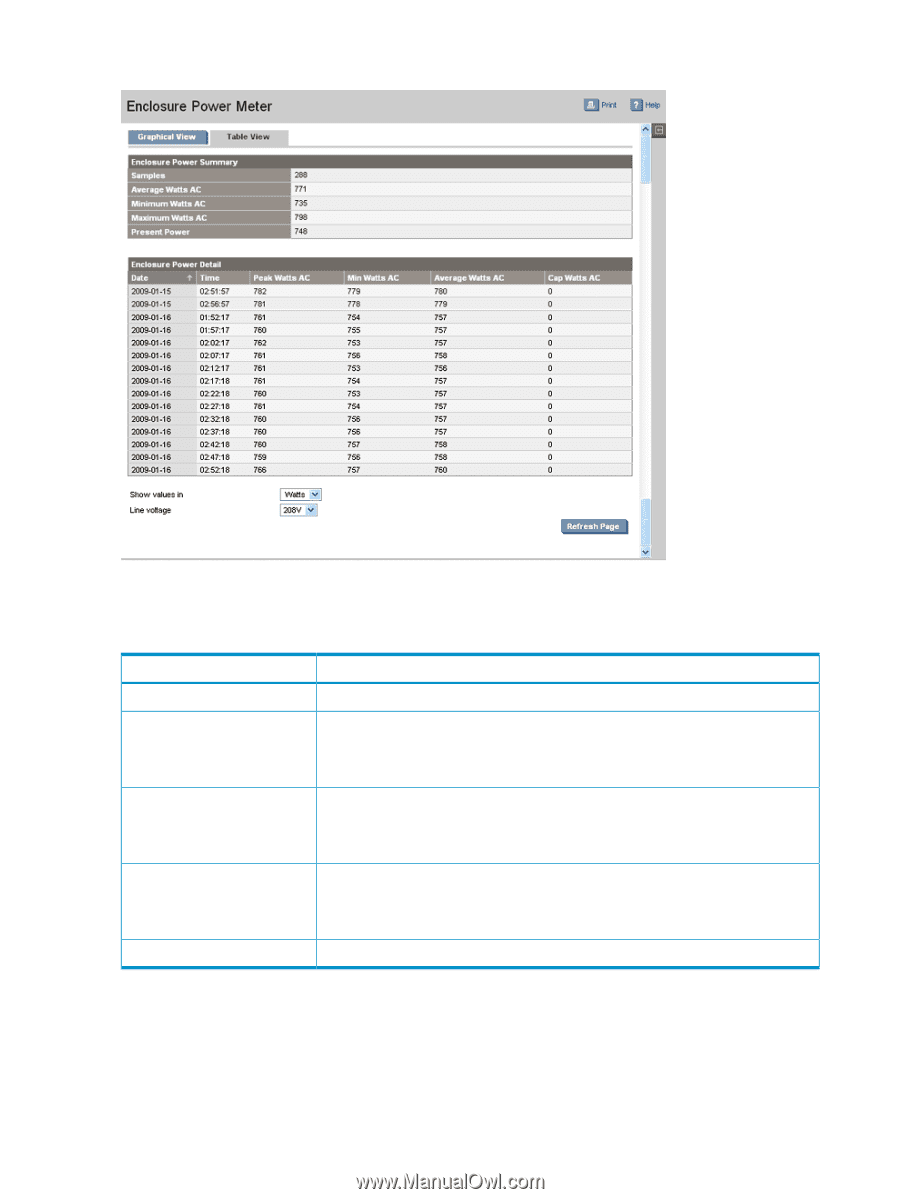
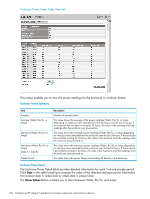
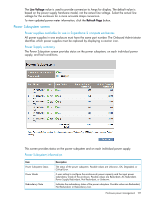
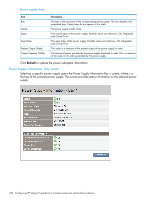
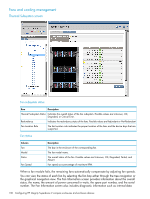
Enclosure Power Meter Table View tab This screen enables you to view the power readings for the enclosure in a tabular format. Enclosure Power Summary Item Samples Average (Watts, Btu/hr, or Amps) Minimum (Watts, Btu/hr, or Amps) Maximum (Watts, Btu/hr, or Amps) (Side A + Side B) Present Power Description Number of samples taken. This value shows the average of the power readings (Watts, Btu/hr, or Amps depending on what you have selected) from the enclosure over the last 24 hours. If the enclosure has not been running for 24 hours, the value is the average of all the readings after the enclosure was powered on. This value shows the minimum power readings (Watts, Btu/hr, or Amps depending on what you have selected) from the enclosure over the last 24 hours. If the enclosure has not been running for 24 hours, the value is the minimum of all the readings after the enclosure was powered on. This value shows the maximum power readings (Watts, Btu/hr, or Amps depending on what you have selected) from the enclosure over the last 24 hours. If the enclosure has not been running for 24 hours, the value is the maximum of all the readings since the enclosure was powered on. This value shows the power being consumed by all devices in the enclosure. Enclosure Power Detail The Enclosure Power Detail table provides detailed information for each 5-minute sample period. Click Date in the table heading to arrange the order of the detailed enclosure power information from present date to oldest date or oldest date to present date. The Show Values in box enables you to select between Watts, Btu/hr, and Amps. 126 Configuring HP Integrity Superdome 2 compute enclosures and enclosure devices
-
 1
1 -
2
-
3
-
4
-
5
-
6
-
7
-
8
-
9
-
10
-
11
-
12
-
13
-
14
-
15
-
16
-
17
-
18
-
19
-
20
-
21
-
22
-
23
-
24
-
25
-
26
-
27
-
28
-
29
-
30
-
31
-
32
-
33
-
34
-
35
-
36
-
37
-
38
-
39
-
40
-
41
-
42
-
43
-
44
-
45
-
46
-
47
-
48
-
49
-
50
-
51
-
52
-
53
-
54
-
55
-
56
-
57
-
58
-
59
-
60
-
61
-
62
-
63
-
64
-
65
-
66
-
67
-
68
-
69
-
70
-
71
-
72
-
73
-
74
-
75
-
76
-
77
-
78
-
79
-
80
-
81
-
82
-
83
-
84
-
85
-
86
-
87
-
88
-
89
-
90
-
91
-
92
-
93
-
94
-
95
-
96
-
97
-
98
-
99
-
100
-
101
-
102
-
103
-
104
-
105
-
106
-
107
-
108
-
109
-
110
-
111
-
112
-
113
-
114
-
115
-
116
-
117
-
118
-
119
-
120
-
 121
121 -
 122
122 -
 123
123 -
 124
124 -
 125
125 -
 126
126 -
 127
127 -
 128
128 -
 129
129 -
 130
130 -
 131
131 -
132
-
133
-
134
-
135
-
136
-
137
-
138
-
139
-
140
-
141
-
142
-
143
-
144
-
145
-
146
-
147
-
148
-
149
-
150
-
151
-
152
-
153
-
154
-
155
-
156
-
157
-
158
-
159
-
160
-
161
-
162
-
163
-
164
-
165
-
166
-
167
-
168
-
169
-
170
-
171
-
172
-
173
-
174
-
175
-
176
-
177
-
178
-
179
-
180
-
181
-
182
-
183
-
184
-
185
-
186
-
187
-
188
-
189
-
190
-
191
 |
 |