HP Integrity Superdome 2 HP Integrity Superdome 2 Onboard Administrator User G - Page 24
Health Summary screen, What is This, Health Summary, Next Alert
 |
View all HP Integrity Superdome 2 manuals
Add to My Manuals
Save this manual to your list of manuals |
Page 24 highlights
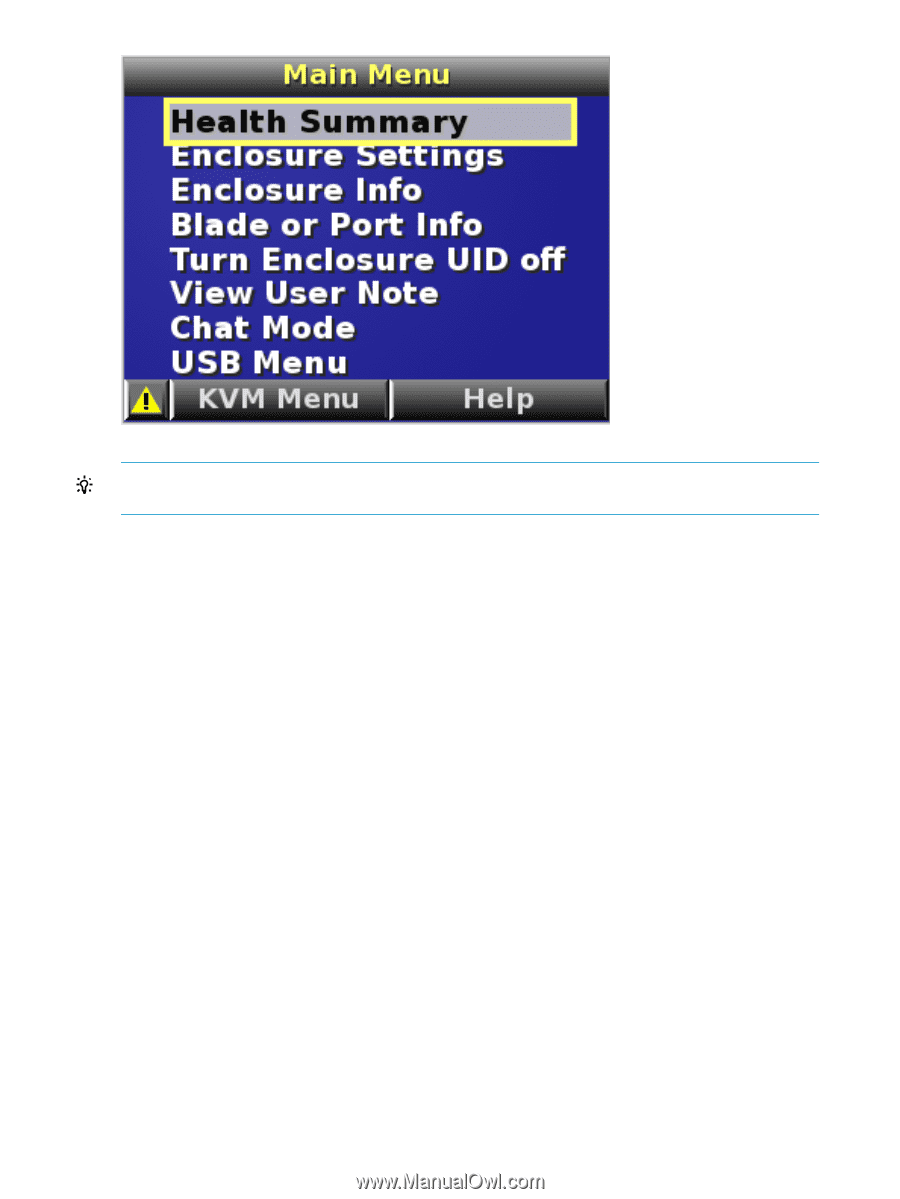
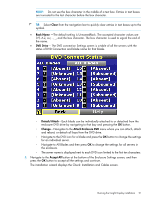
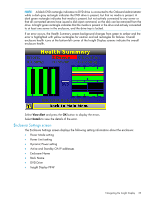
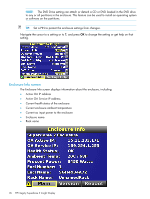
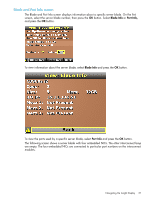
TIP: Within any menu option, navigate the cursor to What is This, and press the OK button to view additional information about each setting, option, or alert. The navigation bar contains options to: • Navigate forward and backward through alert screens • Return to the main menu • Accept changes to current settings • Cancel changes to current settings • Access the Health Summary screen from any screen by selecting the Health Summary icon on the navigation bar Health Summary screen The Health Summary screen displays the current status of the enclosure. The Health Summary screen can be accessed by: • Selecting Health Summary from the Main Menu • Selecting the Health Summary icon from any Insight Display screen When an error or alert condition is detected, the Health Summary screen displays the total number of error conditions and the error locations. Select Next Alert from the navigation bar, and press the OK button to view each individual error condition. The Insight Display displays each error condition in the order of severity. Critical alerts display first (if one exists), followed by caution alerts. When the enclosure is operating normally, the Health Summary screen displays green. The bright green rectangles are components that are installed and are on. A light green rectangle represents a component that is installed, but powered off with no errors. When the enclosure is operating normally, the Health Summary screen displays green. The bright green rectangles are components that are installed and on. A dark green rectangle represents a component that is installed, but powered off with no errors. A black rectangle represents an empty bay. 24 HP Integrity Superdome 2 Insight Display
-
 1
1 -
2
-
3
-
4
-
5
-
6
-
7
-
8
-
9
-
10
-
11
-
12
-
13
-
14
-
15
-
16
-
17
-
18
-
 19
19 -
 20
20 -
 21
21 -
 22
22 -
 23
23 -
 24
24 -
 25
25 -
 26
26 -
 27
27 -
 28
28 -
 29
29 -
30
-
31
-
32
-
33
-
34
-
35
-
36
-
37
-
38
-
39
-
40
-
41
-
42
-
43
-
44
-
45
-
46
-
47
-
48
-
49
-
50
-
51
-
52
-
53
-
54
-
55
-
56
-
57
-
58
-
59
-
60
-
61
-
62
-
63
-
64
-
65
-
66
-
67
-
68
-
69
-
70
-
71
-
72
-
73
-
74
-
75
-
76
-
77
-
78
-
79
-
80
-
81
-
82
-
83
-
84
-
85
-
86
-
87
-
88
-
89
-
90
-
91
-
92
-
93
-
94
-
95
-
96
-
97
-
98
-
99
-
100
-
101
-
102
-
103
-
104
-
105
-
106
-
107
-
108
-
109
-
110
-
111
-
112
-
113
-
114
-
115
-
116
-
117
-
118
-
119
-
120
-
121
-
122
-
123
-
124
-
125
-
126
-
127
-
128
-
129
-
130
-
131
-
132
-
133
-
134
-
135
-
136
-
137
-
138
-
139
-
140
-
141
-
142
-
143
-
144
-
145
-
146
-
147
-
148
-
149
-
150
-
151
-
152
-
153
-
154
-
155
-
156
-
157
-
158
-
159
-
160
-
161
-
162
-
163
-
164
-
165
-
166
-
167
-
168
-
169
-
170
-
171
-
172
-
173
-
174
-
175
-
176
-
177
-
178
-
179
-
180
-
181
-
182
-
183
-
184
-
185
-
186
-
187
-
188
-
189
-
190
-
191
 |
 |