HP Integrity Superdome 2 HP Integrity Superdome 2 Onboard Administrator User G - Page 61
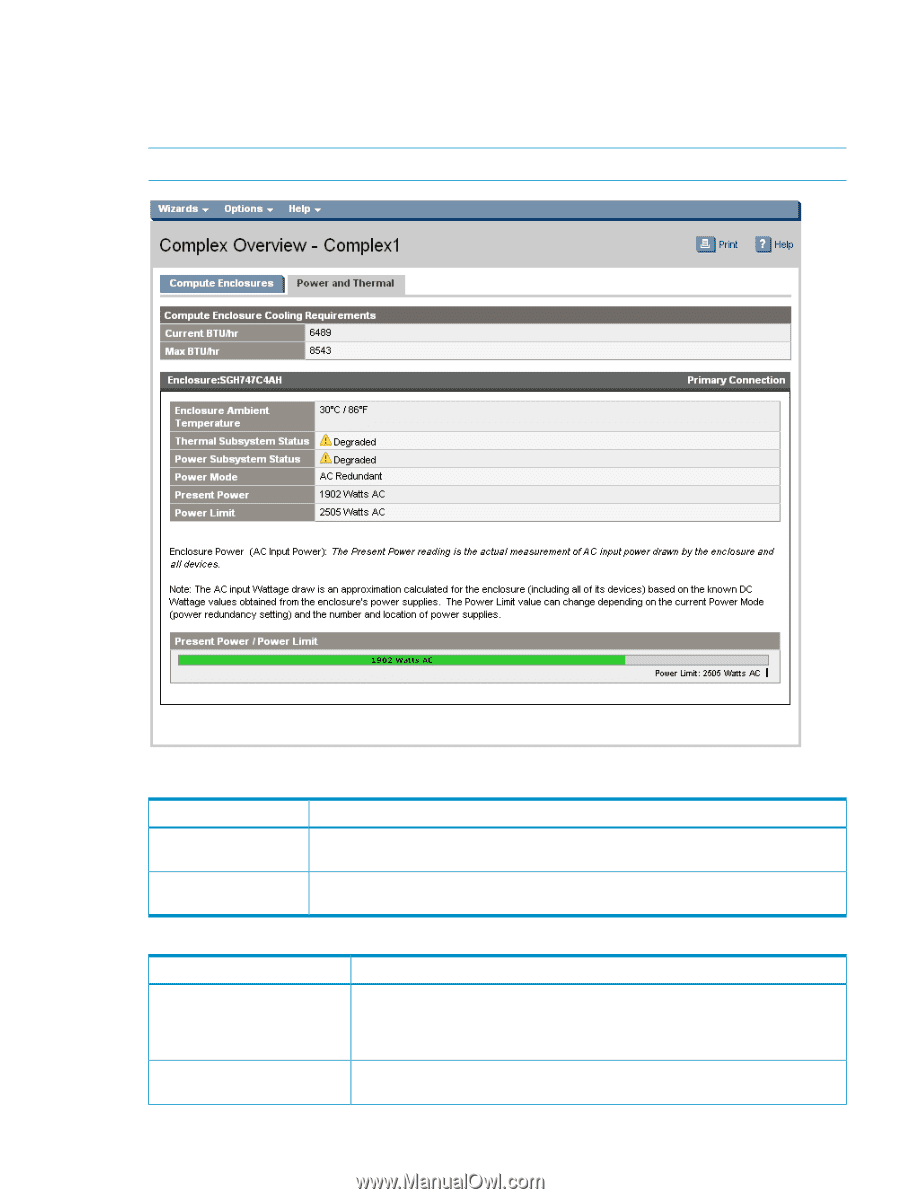
Power and Thermal tab, power and power limit helps you determine the power status.
 |
View all HP Integrity Superdome 2 manuals
Add to My Manuals
Save this manual to your list of manuals |
Page 61 highlights
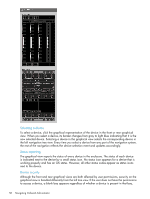
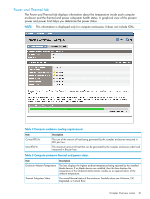
Power and Thermal tab The Power and Thermal tab displays information about the temperature inside each compute enclosure and the thermal and power subsystem health status. A graphical view of the present power and power limit helps you determine the power status. NOTE: This information is displayed only for compute enclosures. It does not include IOXs. Table 2 Compute enclosure cooling requirements Item Current BTU/hr Max BTU/hr Description The sum of the amount of heat being generated by the complex enclosures measured in BTU per hour. The maximum amount of heat that can be generated by the complex enclosures under load measured in Btu per hour. Table 3 Compute enclosure thermal and power status Item Description Enclosure Ambient Temperature This box displays the highest ambient temperature being reported by the installed blade devices. If no blade devices are installed, then this box displays the temperature of the Onboard Administrator module as an approximation of the ambient temperature. Thermal Subsystem Status The overall thermal status of the enclosure. Possible values are Unknown, OK, Degraded, or Critical Error. Complex Overview screen 61
-
 1
1 -
2
-
3
-
4
-
5
-
6
-
7
-
8
-
9
-
10
-
11
-
12
-
13
-
14
-
15
-
16
-
17
-
18
-
19
-
20
-
21
-
22
-
23
-
24
-
25
-
26
-
27
-
28
-
29
-
30
-
31
-
32
-
33
-
34
-
35
-
36
-
37
-
38
-
39
-
40
-
41
-
42
-
43
-
44
-
45
-
46
-
47
-
48
-
49
-
50
-
51
-
52
-
53
-
54
-
55
-
 56
56 -
 57
57 -
 58
58 -
 59
59 -
 60
60 -
 61
61 -
 62
62 -
 63
63 -
 64
64 -
 65
65 -
 66
66 -
67
-
68
-
69
-
70
-
71
-
72
-
73
-
74
-
75
-
76
-
77
-
78
-
79
-
80
-
81
-
82
-
83
-
84
-
85
-
86
-
87
-
88
-
89
-
90
-
91
-
92
-
93
-
94
-
95
-
96
-
97
-
98
-
99
-
100
-
101
-
102
-
103
-
104
-
105
-
106
-
107
-
108
-
109
-
110
-
111
-
112
-
113
-
114
-
115
-
116
-
117
-
118
-
119
-
120
-
121
-
122
-
123
-
124
-
125
-
126
-
127
-
128
-
129
-
130
-
131
-
132
-
133
-
134
-
135
-
136
-
137
-
138
-
139
-
140
-
141
-
142
-
143
-
144
-
145
-
146
-
147
-
148
-
149
-
150
-
151
-
152
-
153
-
154
-
155
-
156
-
157
-
158
-
159
-
160
-
161
-
162
-
163
-
164
-
165
-
166
-
167
-
168
-
169
-
170
-
171
-
172
-
173
-
174
-
175
-
176
-
177
-
178
-
179
-
180
-
181
-
182
-
183
-
184
-
185
-
186
-
187
-
188
-
189
-
190
-
191
 |
 |