Symantec 10744983 Administration Guide - Page 172
Working with logs, Status > Logs, Filter, Display
 |
UPC - 037648279321
View all Symantec 10744983 manuals
Add to My Manuals
Save this manual to your list of manuals |
Page 172 highlights
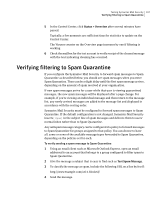
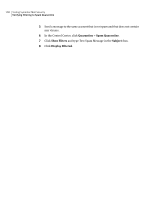
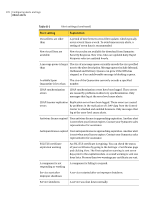
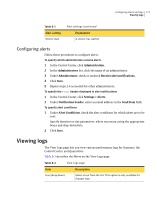
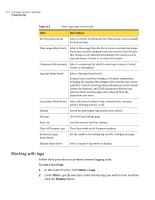
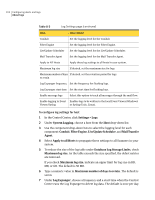
172 Configuring alerts and logs Viewing logs Table 8-2 View Logs page (continued) Item Description Severity (drop-down) Select a severity level from the list. This option is only available for Scanner logs. Time range (drop-down) Select a time range from the list or create a custom time range. If you have recently changed time zones on the Control Center, this change is not reflected immediately, but requires you to stop and restart Tomcat or to reboot the system. Component (drop-down) Select a component for which to view logs: Scanner, Control Center, or Quarantine. Log type (drop-down) Select a log type from the list. Scanner logs record the workings of Scanner components, including the Conduit, Filter Engine, JLU Controller, JLU Client, and MTA. Control Center logs show information on the Control Center, the database, and LDAP. Quarantine Release logs indicate which mail messages were released from the Quarantine and when. Log actions (drop-down) Select the type of actions to log: system events, message actions, blocking actions, or all. Display Search for and display logs that fit your criteria. Settings Go to the Log Settings page. Save Log Save the current log filter settings. Clear All Scanner Logs Clear log records on all Scanner machines. Entries per page (drop-down) Set the number of resulting log records to display per page. Display (drop-down) Select a range of log entries to display. Working with logs Follow these procedures to perform common logging tasks. To view a list of logs 1 In the Control Center, click Status > Logs. 2 Under Filter, specify selection criteria for the logs you wish to view, and then click the Display button.
-
 1
1 -
2
-
3
-
4
-
5
-
6
-
7
-
8
-
9
-
10
-
11
-
12
-
13
-
14
-
15
-
16
-
17
-
18
-
19
-
20
-
21
-
22
-
23
-
24
-
25
-
26
-
27
-
28
-
29
-
30
-
31
-
32
-
33
-
34
-
35
-
36
-
37
-
38
-
39
-
40
-
41
-
42
-
43
-
44
-
45
-
46
-
47
-
48
-
49
-
50
-
51
-
52
-
53
-
54
-
55
-
56
-
57
-
58
-
59
-
60
-
61
-
62
-
63
-
64
-
65
-
66
-
67
-
68
-
69
-
70
-
71
-
72
-
73
-
74
-
75
-
76
-
77
-
78
-
79
-
80
-
81
-
82
-
83
-
84
-
85
-
86
-
87
-
88
-
89
-
90
-
91
-
92
-
93
-
94
-
95
-
96
-
97
-
98
-
99
-
100
-
101
-
102
-
103
-
104
-
105
-
106
-
107
-
108
-
109
-
110
-
111
-
112
-
113
-
114
-
115
-
116
-
117
-
118
-
119
-
120
-
121
-
122
-
123
-
124
-
125
-
126
-
127
-
128
-
129
-
130
-
131
-
132
-
133
-
134
-
135
-
136
-
137
-
138
-
139
-
140
-
141
-
142
-
143
-
144
-
145
-
146
-
147
-
148
-
149
-
150
-
151
-
152
-
153
-
154
-
155
-
156
-
157
-
158
-
159
-
160
-
161
-
162
-
163
-
164
-
165
-
166
-
 167
167 -
 168
168 -
 169
169 -
 170
170 -
 171
171 -
 172
172 -
 173
173 -
 174
174 -
 175
175 -
 176
176 -
 177
177 -
178
-
179
-
180
-
181
-
182
-
183
-
184
-
185
-
186
-
187
-
188
-
189
-
190
-
191
-
192
-
193
-
194
-
195
-
196
-
197
-
198
-
199
-
200
-
201
-
202
-
203
-
204
-
205
-
206
-
207
-
208
-
209
-
210
-
211
-
212
-
213
-
214
-
215
-
216
-
217
-
218
-
219
-
220
-
221
-
222
-
223
-
224
-
225
-
226
-
227
-
228
-
229
-
230
-
231
-
232
-
233
-
234
-
235
-
236
-
237
-
238
-
239
-
240
-
241
-
242
-
243
-
244
-
245
-
246
-
247
-
248
-
249
 |
 |
