HP 6125XLG R2306-HP 6125XLG Blade Switch Fundamentals Command Reference - Page 158
display cpu-usage history, Table 18, Command output
 |
View all HP 6125XLG manuals
Add to My Manuals
Save this manual to your list of manuals |
Page 158 highlights
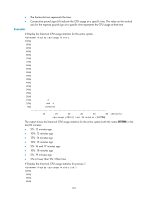
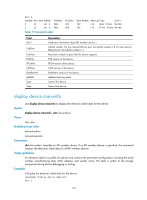
Examples # Display the current CPU usage statistics for all member devices. display cpu-usage Slot 1 CPU 0 CPU usage: 1% in last 5 seconds 1% in last 1 minute 1% in last 5 minutes Table 18 Command output Field 1% in last 5 seconds 1% in last 1 minute 1% in last 5 minutes Slot x CPU y CPU usage Description Average CPU usage during the last 5 seconds. Average CPU usage during the last minute. Average CPU usage during the last 5 minutes. Usage statistics for CPU y of member device x. display cpu-usage history Use display cpu-usage history to display the historical CPU usage statistics in charts. Syntax display cpu-usage history [ job job-id ] [ slot slot-number [ cpu cpu-number ] ] Views Any view Predefined user roles network-admin network-operator Parameters job job-id: Specifies a process by its ID. If no process is specified, this command displays the historical CPU usage statistics for the entire system, which is the sum of the historical CPU usage statistics for all processes in the system. To view the IDs and names of the running processes, use the display process command. For more information, see Network Management and Monitoring Configuration Guide. slot slot-number: Specifies an IRF member device. If no IRF member device is specified, this command displays the historical CPU usage statistics for the master device in the IRF fabric. cpu cpu-number: Displays the historical CPU usage statistics for the specified CPU. The cpu-number argument must be 0. Usage guidelines The system regularly collects CPU usage statistics and saves the statistics in the history record area. This command displays the CPU usage statistics for the last 60 minutes in axes as follows: • The vertical axis represents the CPU usage. If a statistic is not a multiple of the usage step, it is rounded up or down to the closest multiple of the usage step, whichever is closer. For example, if the CPU usage step is 5%, the statistic 53% is rounded up to 55%, and the statistic 52% is rounded down to 50%. 151
-
 1
1 -
2
-
3
-
4
-
5
-
6
-
7
-
8
-
9
-
10
-
11
-
12
-
13
-
14
-
15
-
16
-
17
-
18
-
19
-
20
-
21
-
22
-
23
-
24
-
25
-
26
-
27
-
28
-
29
-
30
-
31
-
32
-
33
-
34
-
35
-
36
-
37
-
38
-
39
-
40
-
41
-
42
-
43
-
44
-
45
-
46
-
47
-
48
-
49
-
50
-
51
-
52
-
53
-
54
-
55
-
56
-
57
-
58
-
59
-
60
-
61
-
62
-
63
-
64
-
65
-
66
-
67
-
68
-
69
-
70
-
71
-
72
-
73
-
74
-
75
-
76
-
77
-
78
-
79
-
80
-
81
-
82
-
83
-
84
-
85
-
86
-
87
-
88
-
89
-
90
-
91
-
92
-
93
-
94
-
95
-
96
-
97
-
98
-
99
-
100
-
101
-
102
-
103
-
104
-
105
-
106
-
107
-
108
-
109
-
110
-
111
-
112
-
113
-
114
-
115
-
116
-
117
-
118
-
119
-
120
-
121
-
122
-
123
-
124
-
125
-
126
-
127
-
128
-
129
-
130
-
131
-
132
-
133
-
134
-
135
-
136
-
137
-
138
-
139
-
140
-
141
-
142
-
143
-
144
-
145
-
146
-
147
-
148
-
149
-
150
-
151
-
152
-
 153
153 -
 154
154 -
 155
155 -
 156
156 -
 157
157 -
 158
158 -
 159
159 -
 160
160 -
 161
161 -
 162
162 -
 163
163 -
164
-
165
-
166
-
167
-
168
-
169
-
170
-
171
-
172
-
173
-
174
-
175
-
176
-
177
-
178
-
179
-
180
-
181
-
182
-
183
-
184
-
185
-
186
-
187
-
188
-
189
-
190
-
191
-
192
-
193
-
194
-
195
-
196
-
197
-
198
-
199
-
200
-
201
-
202
-
203
-
204
-
205
-
206
-
207
-
208
-
209
-
210
-
211
-
212
-
213
-
214
-
215
-
216
-
217
-
218
-
219
-
220
-
221
 |
 |
