HP 6125XLG R2306-HP 6125XLG Blade Switch Fundamentals Command Reference - Page 163
display memory
 |
View all HP 6125XLG manuals
Add to My Manuals
Save this manual to your list of manuals |
Page 163 highlights
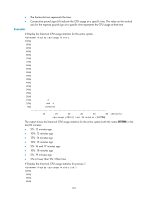
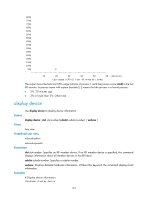
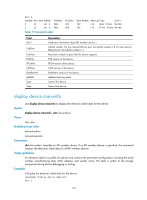
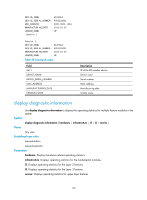
Usage guidelines For diagnostics or troubleshooting, you can use separate display commands to collect running status data module by module or use the display diagnostic-information command to bulk collect running data for multiple modules. This display command does not support the | by-linenum option, the > filename option, or the >> filename option. However, this command asks you whether you want to save the output to a file or display the output on the screen. The file used to save the output is automatically compressed to save storage space. Examples # Display the operating statistics for multiple feature modules in the system. display diagnostic-information Save or display diagnostic information (Y=save, N=display)? [Y/N]:n Please input the file name(*.gz)[flash:/diag.gz]: Diagnostic information is outputting to flash:/diag.gz. Please wait... Save successfully. To view the operating statistics, use the gunzip command to decompress the file diag.gz and then use the more command to view the file content. display memory Use display memory to display memory usage. Syntax display memory [ slot slot-number ] Views Any view Predefined user roles network-admin network-operator Parameters slot slot-number: Specifies an IRF member device by its ID. Without this option, the command displays memory usage for all member devices. Examples # Display memory usage. display memory The statistics about memory is measured in KB: Slot 1: Total Used Free Shared Mem: 1016892 315044 701848 0 -/+ Buffers/Cache: 237148 779744 Swap: 0 0 0 Buffers 0 Cached FreeRatio 77896 69.0% 156
-
 1
1 -
2
-
3
-
4
-
5
-
6
-
7
-
8
-
9
-
10
-
11
-
12
-
13
-
14
-
15
-
16
-
17
-
18
-
19
-
20
-
21
-
22
-
23
-
24
-
25
-
26
-
27
-
28
-
29
-
30
-
31
-
32
-
33
-
34
-
35
-
36
-
37
-
38
-
39
-
40
-
41
-
42
-
43
-
44
-
45
-
46
-
47
-
48
-
49
-
50
-
51
-
52
-
53
-
54
-
55
-
56
-
57
-
58
-
59
-
60
-
61
-
62
-
63
-
64
-
65
-
66
-
67
-
68
-
69
-
70
-
71
-
72
-
73
-
74
-
75
-
76
-
77
-
78
-
79
-
80
-
81
-
82
-
83
-
84
-
85
-
86
-
87
-
88
-
89
-
90
-
91
-
92
-
93
-
94
-
95
-
96
-
97
-
98
-
99
-
100
-
101
-
102
-
103
-
104
-
105
-
106
-
107
-
108
-
109
-
110
-
111
-
112
-
113
-
114
-
115
-
116
-
117
-
118
-
119
-
120
-
121
-
122
-
123
-
124
-
125
-
126
-
127
-
128
-
129
-
130
-
131
-
132
-
133
-
134
-
135
-
136
-
137
-
138
-
139
-
140
-
141
-
142
-
143
-
144
-
145
-
146
-
147
-
148
-
149
-
150
-
151
-
152
-
153
-
154
-
155
-
156
-
157
-
 158
158 -
 159
159 -
 160
160 -
 161
161 -
 162
162 -
 163
163 -
 164
164 -
 165
165 -
 166
166 -
 167
167 -
 168
168 -
169
-
170
-
171
-
172
-
173
-
174
-
175
-
176
-
177
-
178
-
179
-
180
-
181
-
182
-
183
-
184
-
185
-
186
-
187
-
188
-
189
-
190
-
191
-
192
-
193
-
194
-
195
-
196
-
197
-
198
-
199
-
200
-
201
-
202
-
203
-
204
-
205
-
206
-
207
-
208
-
209
-
210
-
211
-
212
-
213
-
214
-
215
-
216
-
217
-
218
-
219
-
220
-
221
 |
 |