Lexmark X925 Lexmark Document Distributor - Page 51
Viewing jobs and the system log, Customizing columns that appear for jobs and the system log
 |
View all Lexmark X925 manuals
Add to My Manuals
Save this manual to your list of manuals |
Page 51 highlights
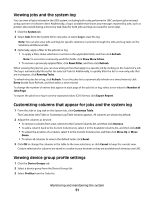
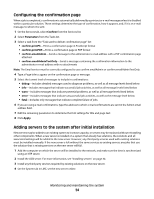
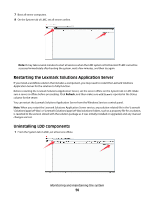
Viewing jobs and the system log You can view all jobs initiated in the LDD system, including both tasks performed in LMC and print jobs initiated using a printer or software client. Additionally, a log is available that shows any messages reported by jobs, such as printers discovered during a discovery task. Data for both jobs and logs are saved for seven days. 1 Click the System tab. 2 Select Jobs from the System list to view jobs, or select Log to view the log. Note: You can also view jobs and logs for specific solutions or printers through the Jobs and Log tasks on the Solutions and Devices tabs. 3 Optionally, apply a filter to the jobs list or log: • To apply a filter, make selections or entries in the applicable fields, and then click Refresh. Note: To access less commonly used filter fields, click Show More Filters. • To remove a previously applied filter, click Reset Filter, and then click Refresh. When viewing the jobs list, you can view all log entries that apply to a specific job by clicking on the Task Id of a job. The log is automatically filtered for the selected Task Id. Additionally, to quickly filter the list to view only jobs that are in progress, click Running Tasks. To refresh the jobs list or log, click Refresh. To set the jobs list to automatically refresh on a timed interval, click Every beside Auto Refresh, and then select a time interval. To change the number of entries that appear in each page of the jobs list or log, select a new value for Number of Jobs/Page. To export the jobs list or log in comma-separated values (CSV) format, click Export Report. Customizing columns that appear for jobs and the system log 1 From the Jobs or Log task on the System tab, click Customize Table. The Customize Jobs Table or Customize Log Table window appears. All columns are shown by default. 2 Adjust the columns as desired: • To remove a column from view, select it in the Current Columns list, and then click Remove. • To add a column back to the Current Columns list, select it in the Available Columns list, and then click Add. • To adjust the position of a column, select it in the Current Columns list, and then click Move Up or Move Down. • To return all columns to view in the default order, click Reset. 3 Click OK to change the columns in the table to the new selections, or click Cancel to keep the current view. Custom selections for columns are saved in a cookie in your browser so they are available each time you use LMC. Viewing device group profile settings 1 Click the Device Groups tab. 2 Select a device group from the Device Groups list. 3 Select Profiles from the Tasks list. Monitoring and maintaining the system 51
-
 1
1 -
2
-
3
-
4
-
5
-
6
-
7
-
8
-
9
-
10
-
11
-
12
-
13
-
14
-
15
-
16
-
17
-
18
-
19
-
20
-
21
-
22
-
23
-
24
-
25
-
26
-
27
-
28
-
29
-
30
-
31
-
32
-
33
-
34
-
35
-
36
-
37
-
38
-
39
-
40
-
41
-
42
-
43
-
44
-
45
-
 46
46 -
 47
47 -
 48
48 -
 49
49 -
 50
50 -
 51
51 -
 52
52 -
 53
53 -
 54
54 -
 55
55 -
 56
56 -
57
-
58
-
59
-
60
-
61
-
62
-
63
-
64
-
65
-
66
-
67
-
68
-
69
-
70
-
71
-
72
-
73
-
74
-
75
-
76
-
77
-
78
-
79
-
80
-
81
-
82
-
83
-
84
-
85
-
86
-
87
-
88
-
89
-
90
-
91
-
92
-
93
-
94
-
95
-
96
-
97
-
98
-
99
-
100
-
101
-
102
-
103
-
104
-
105
-
106
-
107
-
108
-
109
-
110
-
111
-
112
-
113
-
114
-
115
-
116
-
117
-
118
-
119
-
120
-
121
-
122
-
123
-
124
-
125
-
126
-
127
-
128
-
129
-
130
-
131
-
132
-
133
-
134
-
135
-
136
-
137
-
138
-
139
-
140
-
141
 |
 |