Lexmark X925 Lexmark Document Distributor - Page 73
Using built-in reports, Log Report - Failed Jobs
 |
View all Lexmark X925 manuals
Add to My Manuals
Save this manual to your list of manuals |
Page 73 highlights
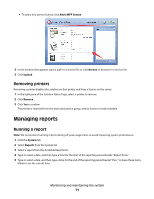
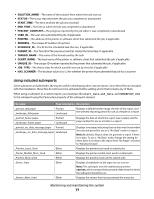
6 Select and configure the scheduled report: a Select a report from the Available Reports list. b Select a Reporting Period. For a scheduled report, each available reporting period is based on the time at which the report is run. c Select an Output Format. Note: Each report has a default selection for Output Format, which may be the format that the report was specifically designed to use. For more information about a custom report, contact the designer of your custom report. d To save the report to a file: 1 Select the check box beside Save To. 2 Click ... beside Save To. 3 Type a Destination Folder Path using either a local drive letter or a UNC path for a network share. 4 If the folder is located on a network share that requires authentication, type the Network share user name and Network share password. 5 Click OK. e To send the report in an e-mail message: 1 Select the check box beside Email To. 2 Click ... beside Email To. 3 Edit the fields of the e-mail message as necessary, and then click OK. f If additional query parameters are available for the selected report, click Additional Parameters to specify values for those parameters. If no additional parameters are available, the button is disabled. 7 Click Next. 8 Enter a start date, and then type the start time. 9 Configure the frequency of the scheduled event, and then click Finish. Using built-in reports Built-in reports are available to display commonly used data. All built-in reports are designed for PDF output, except for those that specify "CSV" in the report title. • Jobs Report - CSV-Displays the jobs list in CSV format • Log Report - CSV-Displays all log entries in CSV format • Log Report - Failed Jobs-Displays log entries for failed jobs • Printer Report-Displays data related to printer usage, such as printer success rates, printer model usage, printer usage per profile, and most active users per printer. • Report by Time-Displays daily and hourly data, such as job totals, job success rates, printer usage, user usage, server usage, and job durations. • Server Report-Displays data related to server usage, such as job success rates, hourly job rates, job duration, and server distribution. Both a summary for all servers and details for individual servers are available. • Software Client Report-Displays data related to software client usage, such as software client success rates, software client usage per profile, and most active users per software client. • Solution Report-Displays data related to solution usage, such as solution success rates, most used solutions, and how solutions were accessed. Monitoring and maintaining the system 73
-
 1
1 -
2
-
3
-
4
-
5
-
6
-
7
-
8
-
9
-
10
-
11
-
12
-
13
-
14
-
15
-
16
-
17
-
18
-
19
-
20
-
21
-
22
-
23
-
24
-
25
-
26
-
27
-
28
-
29
-
30
-
31
-
32
-
33
-
34
-
35
-
36
-
37
-
38
-
39
-
40
-
41
-
42
-
43
-
44
-
45
-
46
-
47
-
48
-
49
-
50
-
51
-
52
-
53
-
54
-
55
-
56
-
57
-
58
-
59
-
60
-
61
-
62
-
63
-
64
-
65
-
66
-
67
-
 68
68 -
 69
69 -
 70
70 -
 71
71 -
 72
72 -
 73
73 -
 74
74 -
 75
75 -
 76
76 -
 77
77 -
 78
78 -
79
-
80
-
81
-
82
-
83
-
84
-
85
-
86
-
87
-
88
-
89
-
90
-
91
-
92
-
93
-
94
-
95
-
96
-
97
-
98
-
99
-
100
-
101
-
102
-
103
-
104
-
105
-
106
-
107
-
108
-
109
-
110
-
111
-
112
-
113
-
114
-
115
-
116
-
117
-
118
-
119
-
120
-
121
-
122
-
123
-
124
-
125
-
126
-
127
-
128
-
129
-
130
-
131
-
132
-
133
-
134
-
135
-
136
-
137
-
138
-
139
-
140
-
141
 |
 |