Dell PowerConnect W-IAP92 Dell Instant 6.2.0.0-3.2.0.0 User Guide - Page 232
Client Alerts Link, IDS Link, Network View
 |
View all Dell PowerConnect W-IAP92 manuals
Add to My Manuals
Save this manual to your list of manuals |
Page 232 highlights
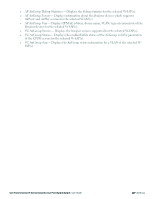
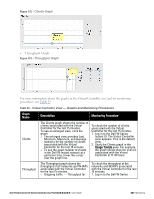
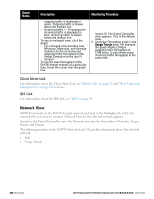
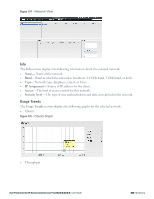
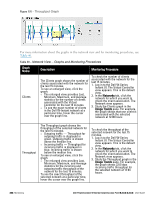
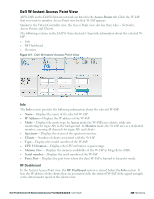
Graph Name Description Monitoring Procedure outgoing traffic is displayed in green. Outgoing traffic is shown above the median line. l Incoming traffic - Throughput for incoming traffic is displayed in blue. Incoming traffic is shown below the median line. To see an enlarged view, click the graph. l The enlarged view provides Last, Minimum, Maximum, and Average statistics for the incoming and outgoing traffic throughput of the Virtual Controller for the last 15 minutes. To see the exact throughput of the Dell W-Instant network at a particular time, hover the cursor over the graph line. Instant UI. The Virtual Controller view appears. This is the default view. 2. Study the Throughput graph in the Usage Trends pane. For example, the graph shows 2.0 kbps outgoing traffic throughput at 12:00 hours. It also shows some incoming traffic throughput at the same time. Client Alerts Link For information about the Client Alerts link, see "Clients Tab" on page 25 and "Alert Types and Management" on page 249 sections. IDS Link For information about the IDS link, see "IDS" on page 39. Network View All Wi-Fi networks in the Dell W-Instant network are listed in the Networks tab. Click the network that you want to monitor. Network View for the selected network appears. Similar to the Virtual Controller view, the Network view also has three tabs- Networks, Access Points, and Clients. The following sections in the Dell W-Series Instant UI, provide information about the selected network: l Info l Usage Trends 232 | Monitoring Dell PowerConnect W-Series Instant Access Point 6.2.0.0-3.2.0.0 | User Guide
-
 1
1 -
2
-
3
-
4
-
5
-
6
-
7
-
8
-
9
-
10
-
11
-
12
-
13
-
14
-
15
-
16
-
17
-
18
-
19
-
20
-
21
-
22
-
23
-
24
-
25
-
26
-
27
-
28
-
29
-
30
-
31
-
32
-
33
-
34
-
35
-
36
-
37
-
38
-
39
-
40
-
41
-
42
-
43
-
44
-
45
-
46
-
47
-
48
-
49
-
50
-
51
-
52
-
53
-
54
-
55
-
56
-
57
-
58
-
59
-
60
-
61
-
62
-
63
-
64
-
65
-
66
-
67
-
68
-
69
-
70
-
71
-
72
-
73
-
74
-
75
-
76
-
77
-
78
-
79
-
80
-
81
-
82
-
83
-
84
-
85
-
86
-
87
-
88
-
89
-
90
-
91
-
92
-
93
-
94
-
95
-
96
-
97
-
98
-
99
-
100
-
101
-
102
-
103
-
104
-
105
-
106
-
107
-
108
-
109
-
110
-
111
-
112
-
113
-
114
-
115
-
116
-
117
-
118
-
119
-
120
-
121
-
122
-
123
-
124
-
125
-
126
-
127
-
128
-
129
-
130
-
131
-
132
-
133
-
134
-
135
-
136
-
137
-
138
-
139
-
140
-
141
-
142
-
143
-
144
-
145
-
146
-
147
-
148
-
149
-
150
-
151
-
152
-
153
-
154
-
155
-
156
-
157
-
158
-
159
-
160
-
161
-
162
-
163
-
164
-
165
-
166
-
167
-
168
-
169
-
170
-
171
-
172
-
173
-
174
-
175
-
176
-
177
-
178
-
179
-
180
-
181
-
182
-
183
-
184
-
185
-
186
-
187
-
188
-
189
-
190
-
191
-
192
-
193
-
194
-
195
-
196
-
197
-
198
-
199
-
200
-
201
-
202
-
203
-
204
-
205
-
206
-
207
-
208
-
209
-
210
-
211
-
212
-
213
-
214
-
215
-
216
-
217
-
218
-
219
-
220
-
221
-
222
-
223
-
224
-
225
-
226
-
 227
227 -
 228
228 -
 229
229 -
 230
230 -
 231
231 -
 232
232 -
 233
233 -
 234
234 -
 235
235 -
 236
236 -
 237
237 -
238
-
239
-
240
-
241
-
242
-
243
-
244
-
245
-
246
-
247
-
248
-
249
-
250
-
251
-
252
-
253
-
254
-
255
-
256
-
257
-
258
-
259
-
260
-
261
-
262
-
263
-
264
-
265
-
266
-
267
-
268
-
269
-
270
-
271
-
272
-
273
-
274
-
275
-
276
-
277
-
278
-
279
-
280
-
281
-
282
-
283
-
284
-
285
-
286
-
287
-
288
-
289
-
290
-
291
-
292
-
293
-
294
-
295
-
296
 |
 |