Dell PowerConnect W-IAP92 Dell Instant 6.2.0.0-3.2.0.0 User Guide - Page 36
Spectrum, Overview (Device list), Channel Utilization and Monitoring,
 |
View all Dell PowerConnect W-IAP92 manuals
Add to My Manuals
Save this manual to your list of manuals |
Page 36 highlights
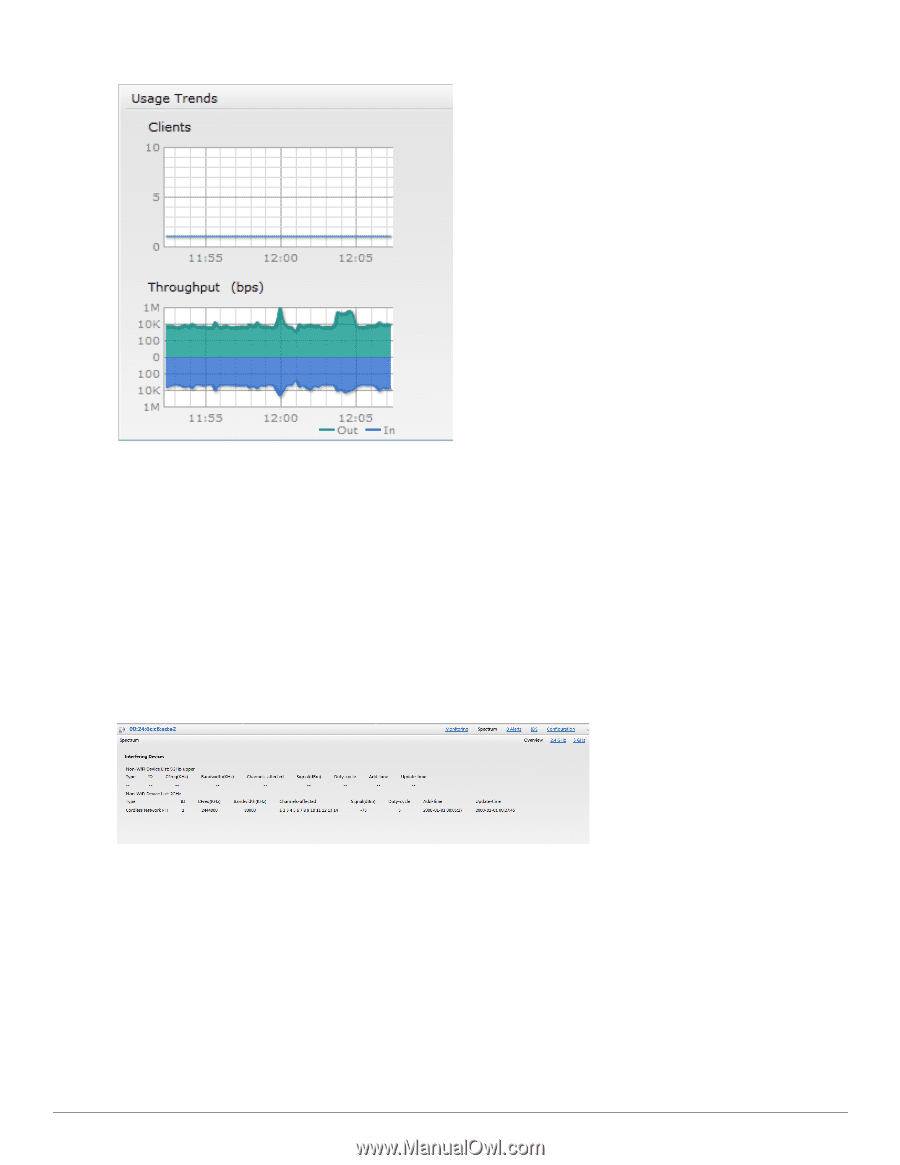
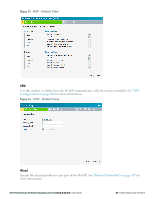
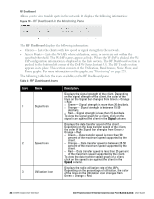
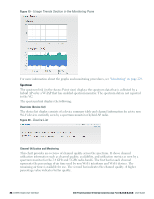
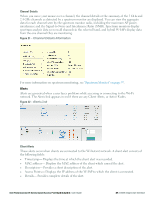
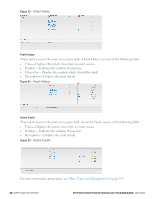
Figure 19 - Usage Trends Section in the Monitoring Pane For more information about the graphs and monitoring procedures, see "Monitoring" on page 229. Spectrum The spectrum link (in the Access Point view) displays the spectrum data that is collected by a hybrid AP or by a W-IAP that has enabled spectrum monitor. The spectrum data is not reported to the VC. The spectrum link displays the following: Overview (Device list) The device list display consists of a device summary table and channel information for active non Wi-Fi devices currently seen by a spectrum monitor or hybrid AP radio. Figure 20 - Device List Channel Utilization and Monitoring This chart provides an overview of channel quality across the spectrum. It shows channel utilization information such as channel quality, availability, and utilization metrics as seen by a spectrum monitor for the 2.4 GHz and 5 GHz radio bands. The first bar for each channel represents the percentage of air time used by non Wi-Fi interferers and Wi-Fi devices. The remaining air time is available for use. The second bar indicates the channel quality. A higher percentage value indicates better quality. 36 | Dell W-Instant User Interface Dell PowerConnect W-Series Instant Access Point 6.2.0.0-3.2.0.0 | User Guide
-
 1
1 -
2
-
3
-
4
-
5
-
6
-
7
-
8
-
9
-
10
-
11
-
12
-
13
-
14
-
15
-
16
-
17
-
18
-
19
-
20
-
21
-
22
-
23
-
24
-
25
-
26
-
27
-
28
-
29
-
30
-
 31
31 -
 32
32 -
 33
33 -
 34
34 -
 35
35 -
 36
36 -
 37
37 -
 38
38 -
 39
39 -
 40
40 -
 41
41 -
42
-
43
-
44
-
45
-
46
-
47
-
48
-
49
-
50
-
51
-
52
-
53
-
54
-
55
-
56
-
57
-
58
-
59
-
60
-
61
-
62
-
63
-
64
-
65
-
66
-
67
-
68
-
69
-
70
-
71
-
72
-
73
-
74
-
75
-
76
-
77
-
78
-
79
-
80
-
81
-
82
-
83
-
84
-
85
-
86
-
87
-
88
-
89
-
90
-
91
-
92
-
93
-
94
-
95
-
96
-
97
-
98
-
99
-
100
-
101
-
102
-
103
-
104
-
105
-
106
-
107
-
108
-
109
-
110
-
111
-
112
-
113
-
114
-
115
-
116
-
117
-
118
-
119
-
120
-
121
-
122
-
123
-
124
-
125
-
126
-
127
-
128
-
129
-
130
-
131
-
132
-
133
-
134
-
135
-
136
-
137
-
138
-
139
-
140
-
141
-
142
-
143
-
144
-
145
-
146
-
147
-
148
-
149
-
150
-
151
-
152
-
153
-
154
-
155
-
156
-
157
-
158
-
159
-
160
-
161
-
162
-
163
-
164
-
165
-
166
-
167
-
168
-
169
-
170
-
171
-
172
-
173
-
174
-
175
-
176
-
177
-
178
-
179
-
180
-
181
-
182
-
183
-
184
-
185
-
186
-
187
-
188
-
189
-
190
-
191
-
192
-
193
-
194
-
195
-
196
-
197
-
198
-
199
-
200
-
201
-
202
-
203
-
204
-
205
-
206
-
207
-
208
-
209
-
210
-
211
-
212
-
213
-
214
-
215
-
216
-
217
-
218
-
219
-
220
-
221
-
222
-
223
-
224
-
225
-
226
-
227
-
228
-
229
-
230
-
231
-
232
-
233
-
234
-
235
-
236
-
237
-
238
-
239
-
240
-
241
-
242
-
243
-
244
-
245
-
246
-
247
-
248
-
249
-
250
-
251
-
252
-
253
-
254
-
255
-
256
-
257
-
258
-
259
-
260
-
261
-
262
-
263
-
264
-
265
-
266
-
267
-
268
-
269
-
270
-
271
-
272
-
273
-
274
-
275
-
276
-
277
-
278
-
279
-
280
-
281
-
282
-
283
-
284
-
285
-
286
-
287
-
288
-
289
-
290
-
291
-
292
-
293
-
294
-
295
-
296
 |
 |